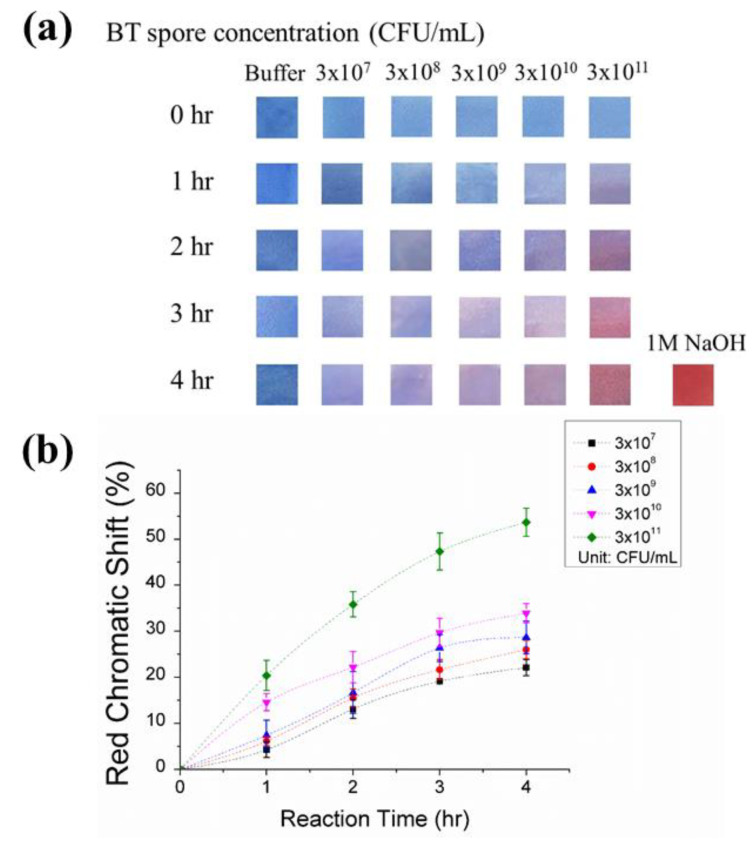
Figure 3.
PDA strip detection of BT spores. (a) Images of the paper strips after incubation in spore solutions of different concentrations for 4 h. The negative and positive control images are from strips dipped in PBS (5 mM, pH = 7.5), and 1 M NaOH, respectively. (b) Red chromatic shift of the strips after 1 h, 2 h, 3 h, and 4 h of incubation in the spore solutions. Red chromatic shift data are presented as the mean ± SD (n = 3).

