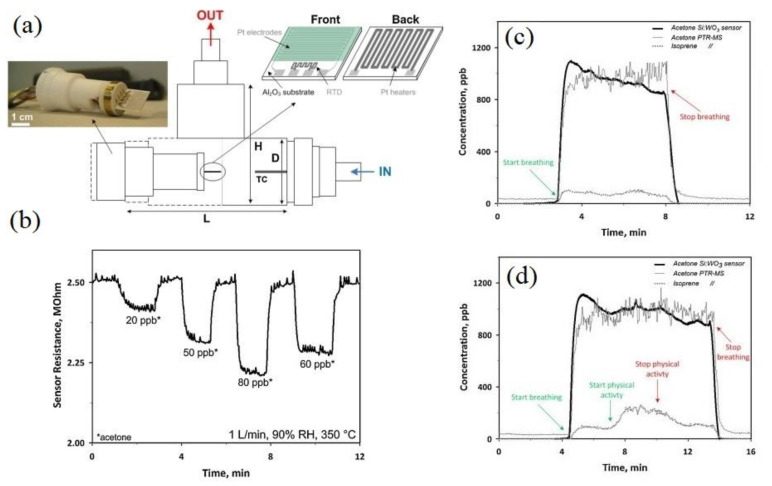
Figure 6.
(a) Schematic of gas chamber used for breath analysis. (L = 75, H = 50, and D = 18 mm, thermocouple (TC). (b) Dynamic resistance curve of 10 mol% Si-doped WO3 gas sensor to low concentrations of acetone under 90% RH at 350 °C. (c) Dynamic resistance curves of the Si:WO3 sensor (thick solid line), acetone (thin solid line), and isoprene (dotted line) gas tested using proton transfer reaction mass spectrometry (PTR-MS) through breathing of a test person (c) at rest and (d) during physical activity [115]. Reprint permission was obtained from Elsevier.

