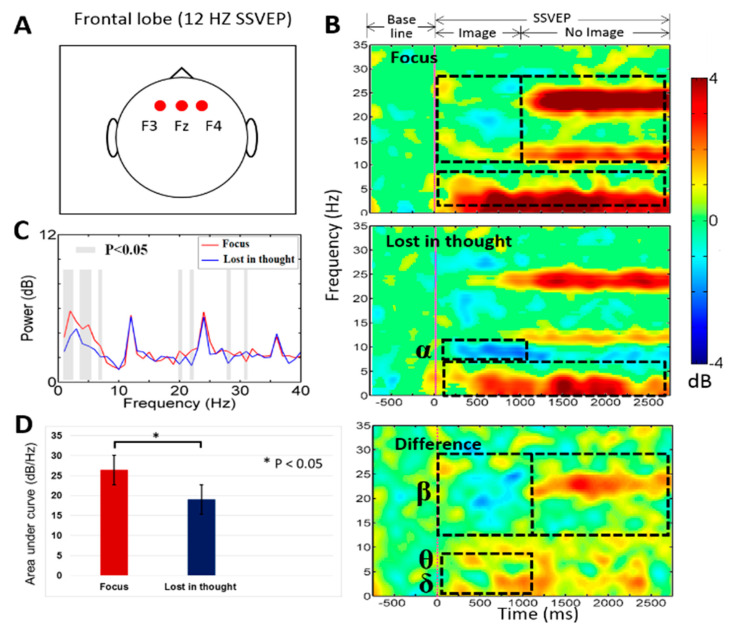
Figure 4.
(A) Displays electrodes (F3, Fz, F4) location in frontal lobe. (B) The event-related spectral perturbation (ERSP) was observed during mental focus and lost-in-thought states at 12 Hz SSVEP flicker frequency. The pink vertical line shows the stimulus onset. Statistic at p < 0.05. Color bar indicate the scale of significant ERSP in decibel (dB). (C) The power spectral density (PSD) for the mental focus state (red line) and lost-in-thought state (blue line). The grey areas represents statistically pairwise significant difference (p < 0.05) in t-test between mental focus and lost-in-thought states. (D) The area under curve (AUC) was measured in mental focus and lost-in-thought states (* p < 0.05).

