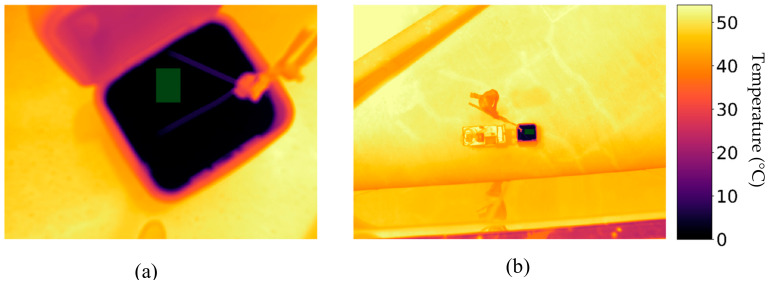
Figure 11.
(a) Temperature map of a cooler filled with ice taken at a distance of ~40 cm with an ambient temperature of 37 °C. The average value of the ice pixels inside the cooler (represented by the green rectangle) was –0.105 °C. (b) Temperature map of same ice filled cooler taken at a distance of ~10m. The average value of ice only pixels (green rectangle) was 4.064 °C illustrating that thermographies can present adjacency effects. The images displayed were collected manually with a FLIR A655sc camera and subjected to the calibration matrices described in this research.

