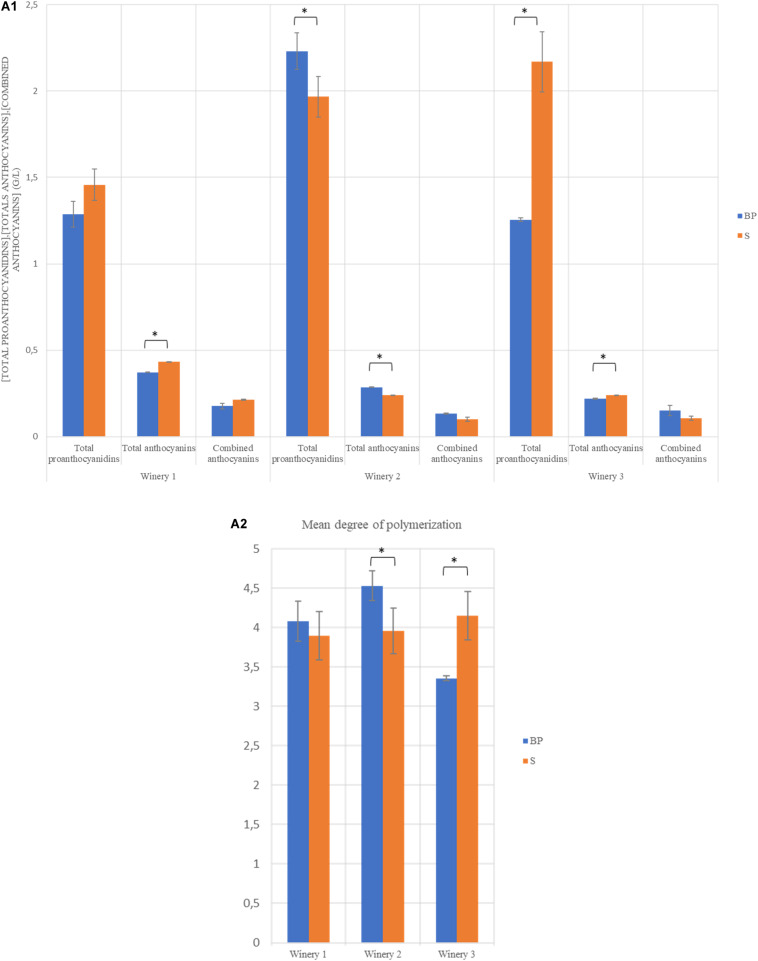
FIGURE 1.
Histogram representing the concentration of total proanthocyanidins, total anthocyanins, combined anthocyanins in g/L (A1) and the mean degree of polymerisation (mDP) (A2) at the end of MLF in each winery. ∗The Tukey test found significant differences between the two modalities of the same winery.

