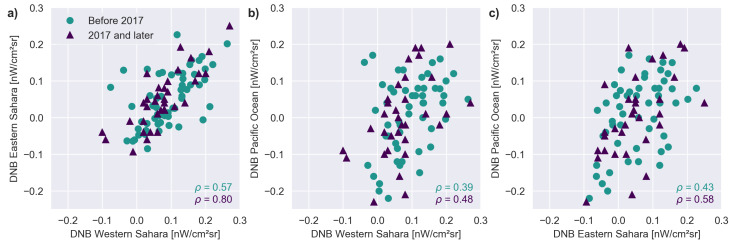
Figure 2.
These scatterplots compare the three pairs of data from Figure 1. The symbols indicate the two time periods. For the data after 2017, 0.15 nWcmsrwas subtracted from the reported radiance, in order to reduce the false appearance of a correlation. (a) Eastern and Western Sahara. (b) Western Sahara and Pacific Ocean (c) Eastern Sahara and Pacific Ocean. The Pearson correlation coefficients (p) for each dataset and time period are shown on each figure.

