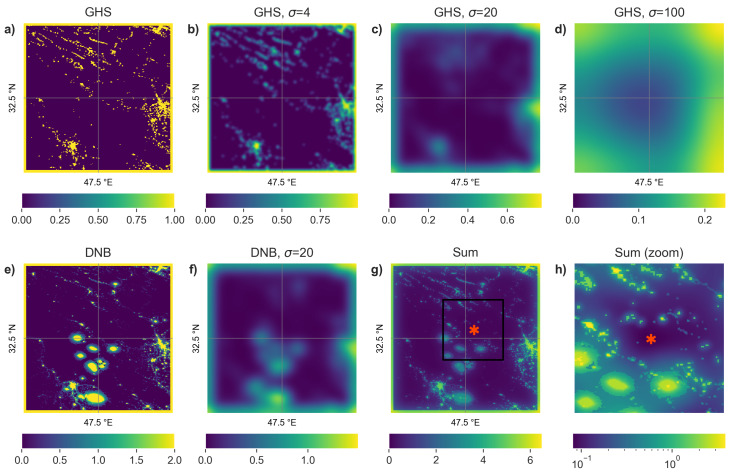
Figure 3.
Example of images used to select one site in Iran near oil flaring (32 N, 47.5 E). (a) Global Human Settlement Layer population density map converted to binary and with a 10 pixel buffer at the edges. (b) Panel (a) smeared with a Gaussian kernel with width 4 pixels. (c) Panel (a) smeared with a Gaussian kernel with width 20 pixels. (d) Panel (a) smeared with a Gaussian kernel with width 100 pixels. The ovals are due to oil flares. (e) DNB values (capped at 10 nWcmsrand divided by 5) with a 10 pixel buffer at the edges. (f) Panel (e) smeared with a Gaussian kernel with width 20 pixels. (g) Sum of panels a–f. The red star shows the location of the minimum. (h) zoom in of panel (g), showing the area near the minimum. Note that the colorbar range is not the same in each panel, and is logarithmic for panel (h).

