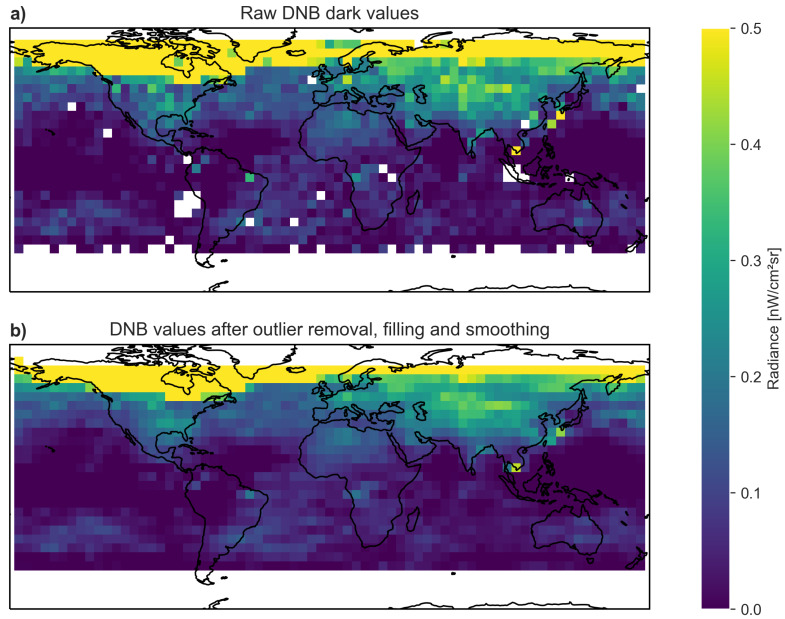
Figure 5.
Radiance values at the 2016 grid locations in November, 2015, overlaid on a map of Earth. (a) Radiance values in the DNB composite, with missing data shown in white. (b) Radiance values after filling outliers and smoothing. Note that the colorbar is clipped at 0.5 nWcmsrto show more details. The values in the auroral ring are considerably higher than 0.5 nWcmsr.

