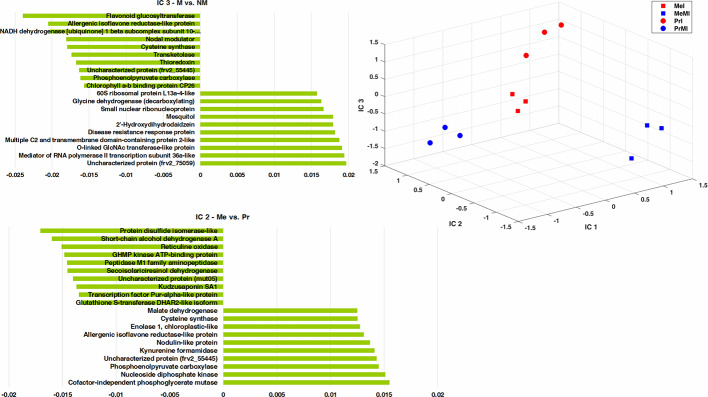
Figure 3.
ICA of integrated seed metabolomics-proteomics data including remarkably changed (Kruskal-Wallis; ANOVA, Tukey HSD test; p < 0.05 and ≥ two-fold change) seed metabolites and proteins in M vs. NM upon diseased conditions of both cultivars. Numeric data were z-transformed. The loadings graphs illustrate the components with the top ten of the highest loadings (> 0.01 and < −0.01) on IC2 and IC3. Me, cv. Messire; Pr, cv. Protecta; M, mycorrhizal; I, infected (diseased).

