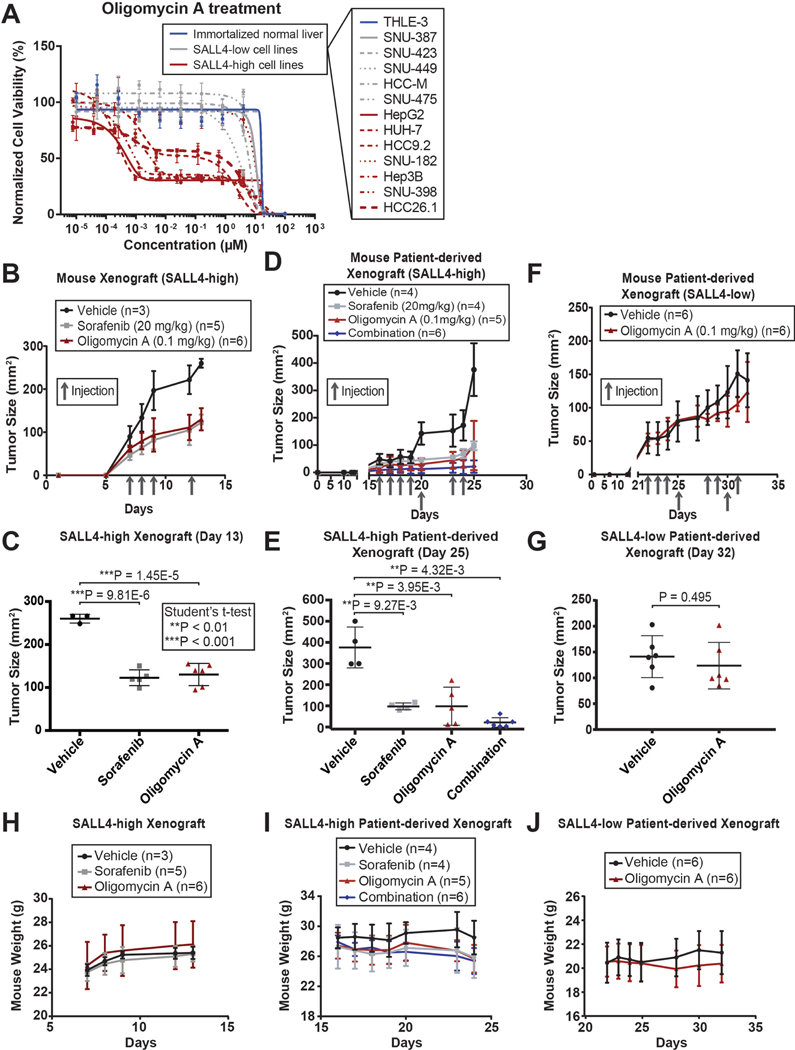
Fig. 3. Oligomycin A suppresses SALL4-dependent HCC.
(A) Cell viability dose-response curves for a panel of HCC cell lines treated with oligomycin A for 72 hrs, measured with CellTiter-Glo reagent and normalized to untreated cell viability (mean of 3 replicates ± SD). (B) Tumor size plot of SALL4-high SNU-398 mouse xenografts injected (intraperitoneal) with vehicle, sorafenib, or oligomycin A (mean ± SD). (C) Plot of tumor size at day 13 of the xenograft experiments in (B) (mean ± SD). (D) Tumor size plot of SALL4-high PDX HCC26.1 mouse xenografts injected (intraperitoneal) with vehicle, sorafenib, oligomycin A, or a combination of 20 mg/kg sorafenib and 0.1 mg/kg oligomycin (mean ± SD). (E) Plot of tumor size at day 25 of the xenograft experiments in (D) (mean ± SD). (F) Tumor size plot of SALL4-low PDX1 mouse xenografts injected (intraperitoneal) with vehicle or oligomycin A (mean ± SD). (G) Plot of tumor size at day 32 of the xenograft experiments in (F) (mean ± SD). (H-J) Mouse weight quantification plot from the respective mouse xenograft experiments in (B-G) (mean ± SD).

