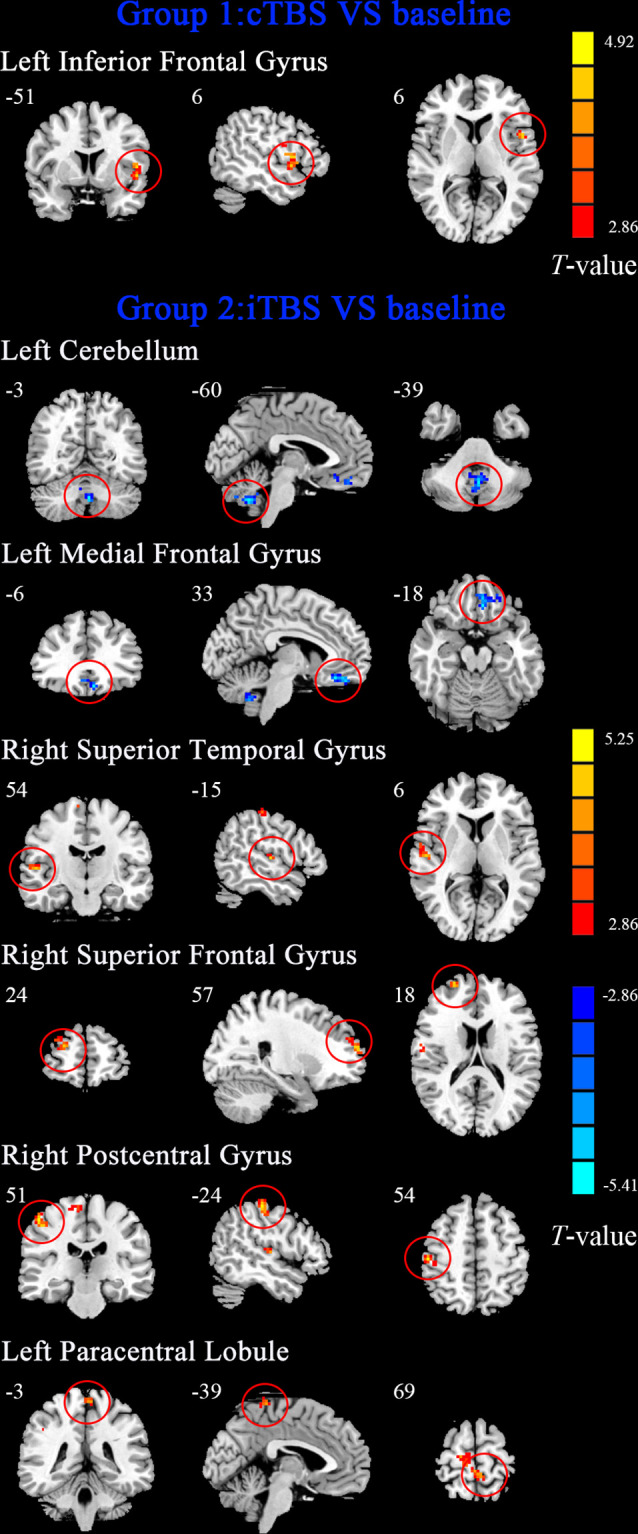
Figure 1.

The maps showed that the alteration of degree centrality (DC) after continuous theta-burst stimulation (cTBS) and intermittent theta-burst stimulation (iTBS) protocols on the motor cortex of suprahyoid motor cortex in healthy subjects. Regions with red color represent significantly increased DC values in the theta-burst stimulation (TBS) compared with the baseline, and blue indicates the opposite (p < 0.01, corrected). The details are described in Table 2. The color bar indicates the t-score.
