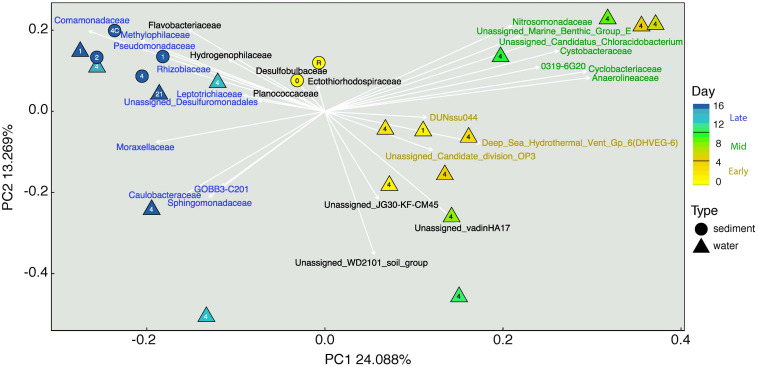
FIGURE 3.
Principal component ordination of beta diversity for samples collected from sediments and groundwater during MICP field study. Eigenvectors (arrows) overlaid onto this plot show families that are most representative of samples of that vector space. Symbol shape corresponds to sample type (circles = sediments; triangles = groundwater) and color indicates the sample collection period. The number in the center of each symbol indicates the well from which the sample was obtained. Text color corresponds to significant taxa by LEfSe analysis where: yellow = “early” (0–4 days), green = “mid” (5–10 days), blue = “late” (11–16 days). Black colored taxa were not found to be significant indicator taxa by LEfSe.

