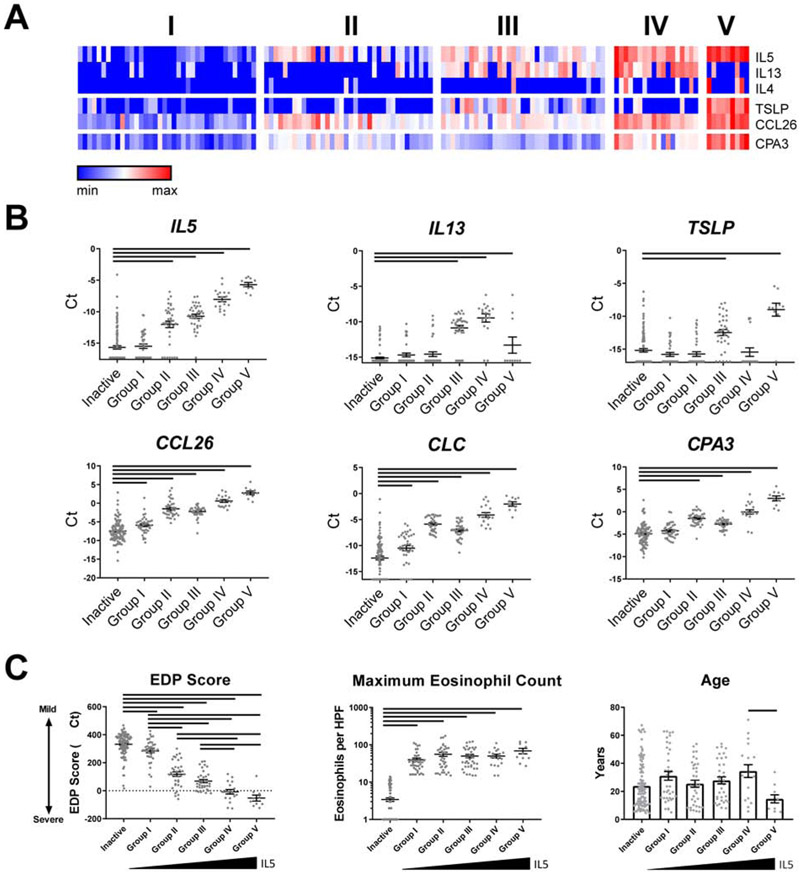
FIG 3:
Expression of Th2 genes in active EoE identifies distinct patient groups. (A) Five subgroups of active EoE were identified by K-means clustering based on expression of IL4, IL5, IL13, TSLP, CCR3, CCL26, CLC, and CPA3. (B) Normalized expression of Th2 genes was compared in inactive patients and 5 groups of active patients. Bars indicate statistical differences (P < 0.05) between inactive patients and specified groups, assessed by one-way ANOVA with Dunnett’s post-test. (C) EDP score and patient age were compared between inactive patients and active groups I-V by one-way ANOVA with Tukey post-test. Maximum eosinophil count was compared via Kruskal-Wallis test with Dunn’s post-test. Bars indicate P < 0.05. The data shown includes the cumulative results of all samples performed over 78 Custom TaqMan Gene Expression Array Cards.

