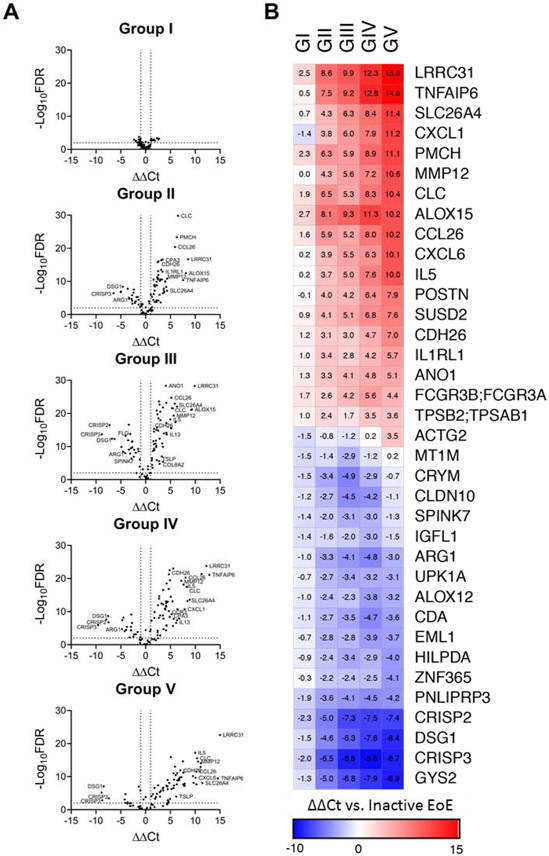
FIG 5:
Differential gene expression in Th2 subgroups. (A) The ΔΔ Ct values (ΔCtGROUP - ΔCtINACTIVE) and accompanying statistical significance (-log10FDR) were calculated for the entire EDP in each group with respect to patients with inactive EoE. Dotted lines indicate significance thresholds at – log10(FDR)>2 and ∣ ΔΔ Ct∣ > 1. Genes of particular interest are annotated. (B) ΔΔ Ct values of the highest up- and downregulated genes in each group with respect to inactive EoE.

