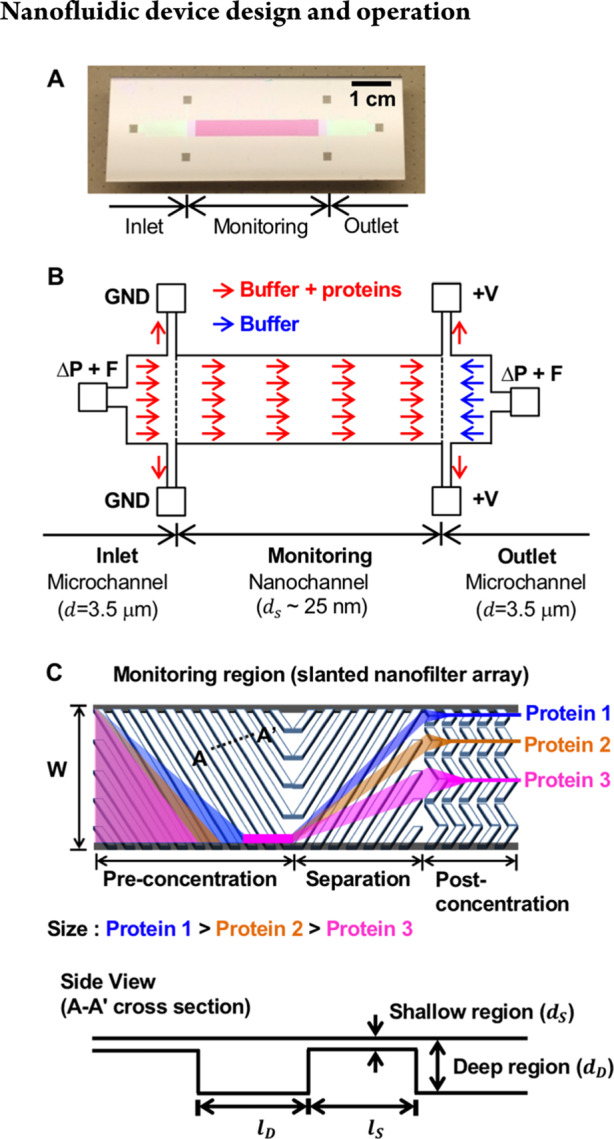
Figure 1.

Schematic of the nanofluidic device used for the online monitoring system. (A) A photograph of the nanofluidic device (top view). (B) Details of the device structure and flow direction. (ΔP: pressure-driven flow, F: electrically floated, GND: ground, + V: high voltage). (C) Detail of the nanofilter array. The slanted nanofilter array in the monitoring region has periodically patterned and slanted deep (dD) and shallow (dS) regions. (dD = 100 nm, dS = 25 nm, θ = 45° (nanofilter angle), lS and lD = 1 μm (pitch size of the nanofilter array), W = 4 mm). The figure from ref (5) was reprinted by permission from Macmillan Publishers Ltd.: Nature Nanotechnology, copyright (2017).
