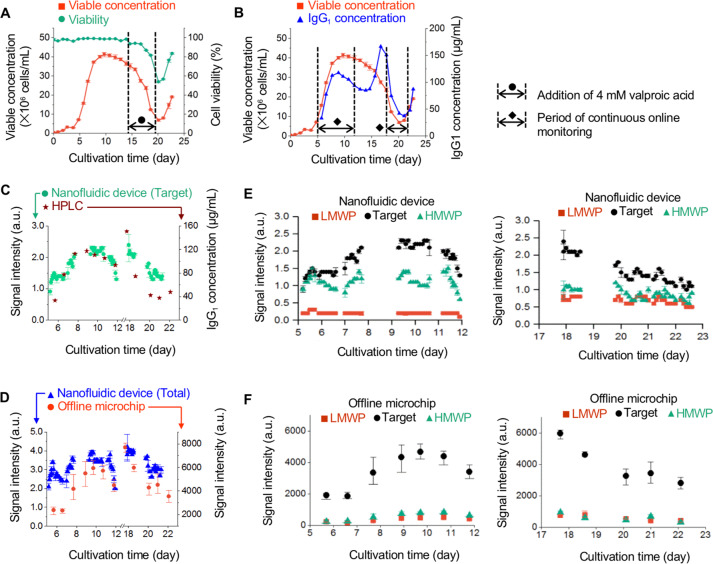
Figure 5.
Continuous online protein size monitoring during transient-state IgG1 production. (A) Viable cell concentration and viability during perfusion culture. Perfusion began around day 3. Valproic acid (4 mM) was continuously added to the bioreactor from day 14.6 to day 18.6. (B) Viable cell and IgG1 concentrations. The online monitoring was performed at two time periods (days 5–12 and days 17–23). (C) Protein signals in the Target group (including IgG1) measured by the online monitoring system and IgG1 concentration obtained by affinity chromatography (HPLC). There are missing data points in the plots (e.g., days 8–9 and days 18.5–19.5) because continuous sample preparation and image acquisition failed. (D) Trend of total amount of proteins measured by the online monitoring system and the offline gel electrophoresis microchip. (E) and (F) Characteristics of proteins in three size groups (LMWP, Target, HMWP) over cultivation time measured by the nanofluidic device (E) and the offline gel electrophoresis microchip (F). For the viable concentration, viability, and offline microchip, error bars are data range (n = 3, technical replicates); For the nanofluidic device, error bars are standard deviation (n = 12).

