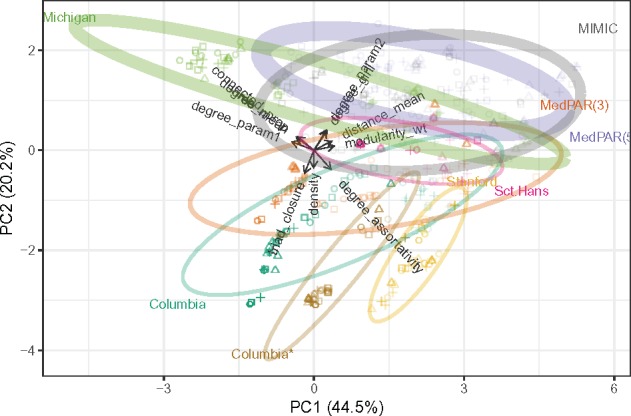
Figure 2.

Row-principal PCA biplot for the summary statistics with networks (cases) in principal coordinates and statistics (variables) in standard coordinates. The values for graphs constructed from a common dataset are summarized by 95% confidence ellipses. Symbol corresponds to BAM, color indicates data source, and opacity is proportional to network density. Ellipse thicknesses are proportional to the number of clinical concepts (nodes) in the ontology (graph).
