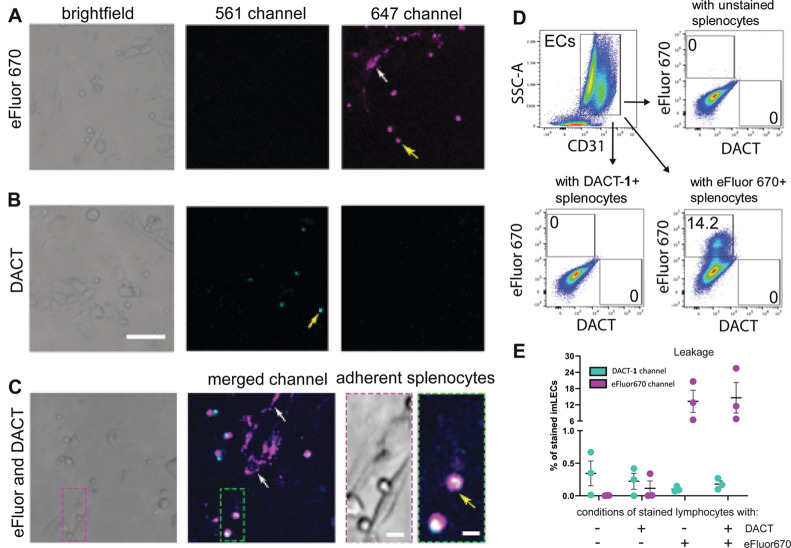
Figure 4.
Minimal DACT-1 intercellular transfer in coculture studies. Representative images of splenocytes labeled with DACT-1 (A), eFluor670 (B), and mixed in a 1:1 ratio (C), incubated on imLECs for 19 h. Examples of splenocytes are indicated with yellow arrows, and examples of leakage to ECs are shown with white arrows. Scale bars = 50 μm in A, 5 μm in C. (D) Representative FACS analysis of coculture studies of CD31+ imLECs (Figures S14, S15). (E) Analysis of the total percentage of imLECs stained with DACT-1 and eFluor670 caused by intercellular transfer of dyes from splenocytes. Data are plotted as mean ± SEM (n = 3 independent experiments are pooled).

