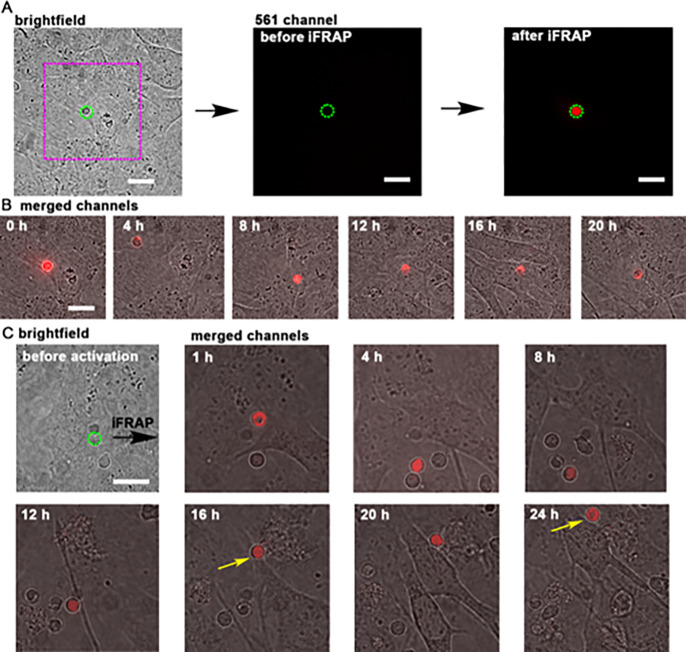
Figure 5.
Long-term tracking of a single splenocyte on an imLEC monolayer. (A) Brightfield image of a splenocyte (dashed green line) on an imLEC monolayer. Fluorescent intensity in the 561 nm channel (5 s, 120 mW) recorded before and after iFRAP (405 nm, 1 s, 30 mW). (B) Time lapse of the ROI (magenta dotted square) displayed in panel A of the same lymphocyte over the course of 20 h. (C) Example of a splenocyte selected in brightfield mode, activated with iFRAP and tracked over 24 h (same irradiation conditions). Crawling of the splenocyte is observed between 16 and 24 h (yellow arrows). Representative data from two out of 12 experiments are shown. Scale bars = 5 μm.

