Fig. 2.

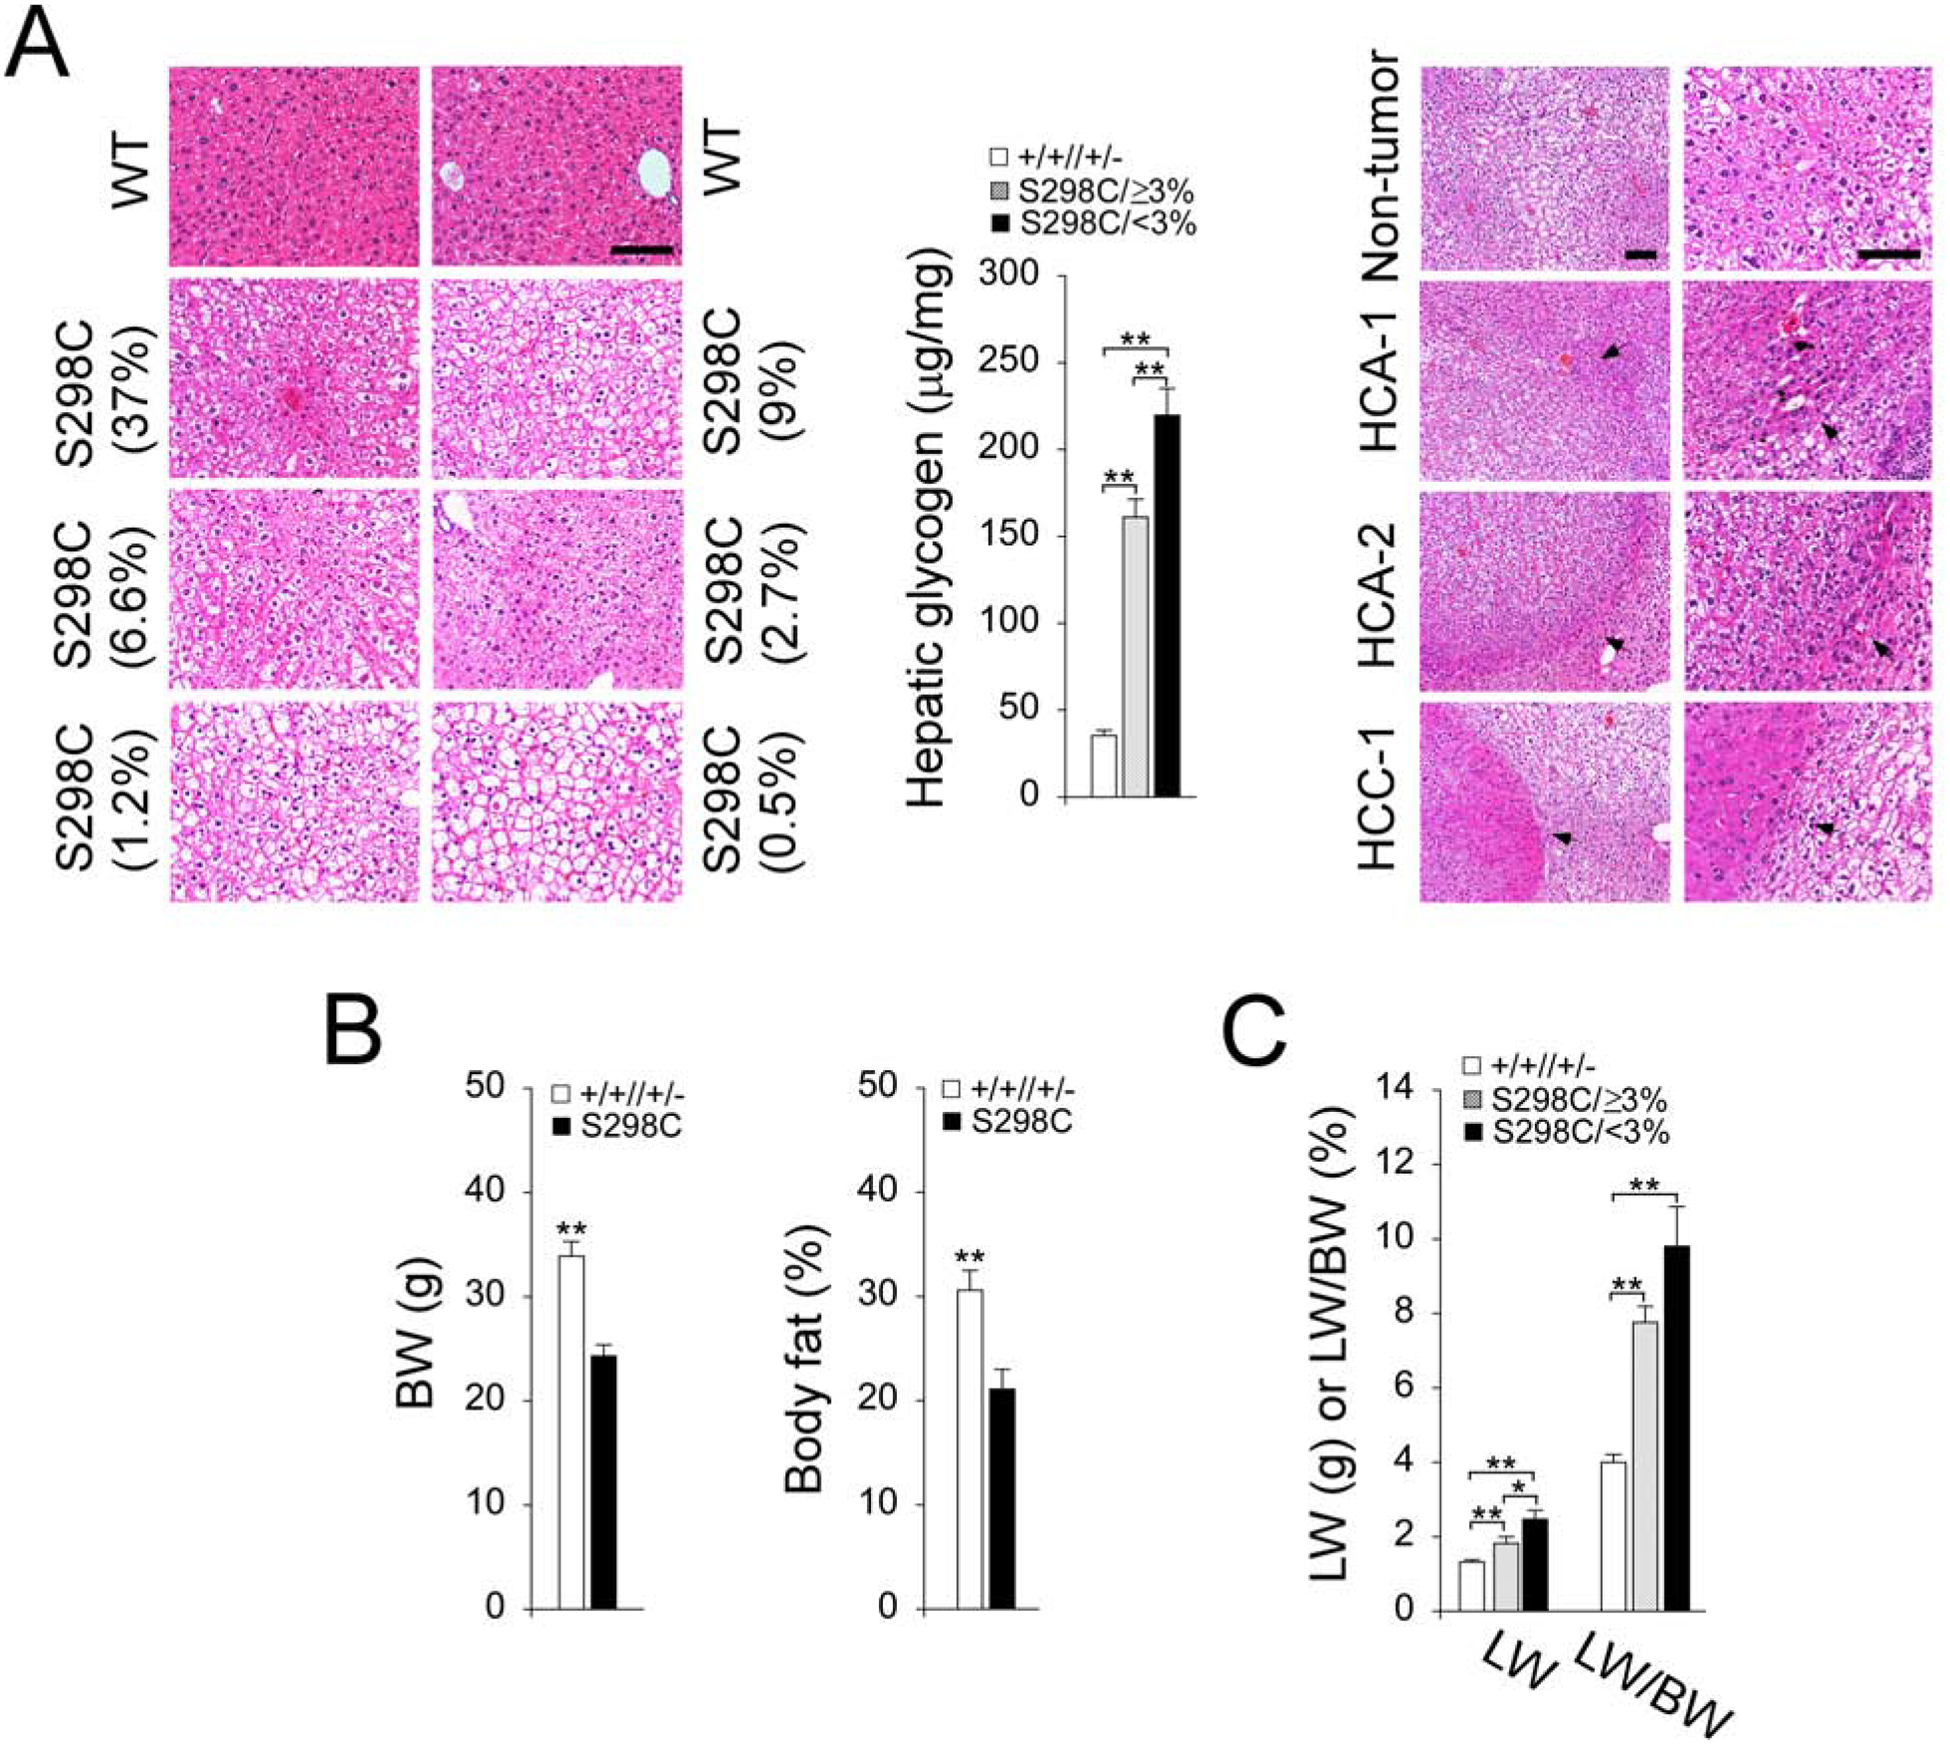
Phenotypic analysis of 62–66-week-old rAAV-G6PC-G6PC-S298C-treated G6pc−/− mice. (A) H&E stained liver sections and hepatic glycogen contents. Each plate represents an individual mouse. Numbers in parentheses represent % of hepatic G6Pase-α activity restored in the mice. The representative hematoxylin and eosin (H&E) stained non-tumor and tumor lesions in the tumor-bearing S298C/<3% mouse are shown. The arrow denotes HCA/HCC. Scale bar = 100μm. (B) Body weight (BW) and body fat values. Both values were similar between S298C/≥3% and S298C/<3% mice and were grouped as the S298C (n = 17) mice. (C) Liver weight (LW) and LW/BW values. Data represent the mean ± SEM. *p< 0.05, **p< 0.005.
