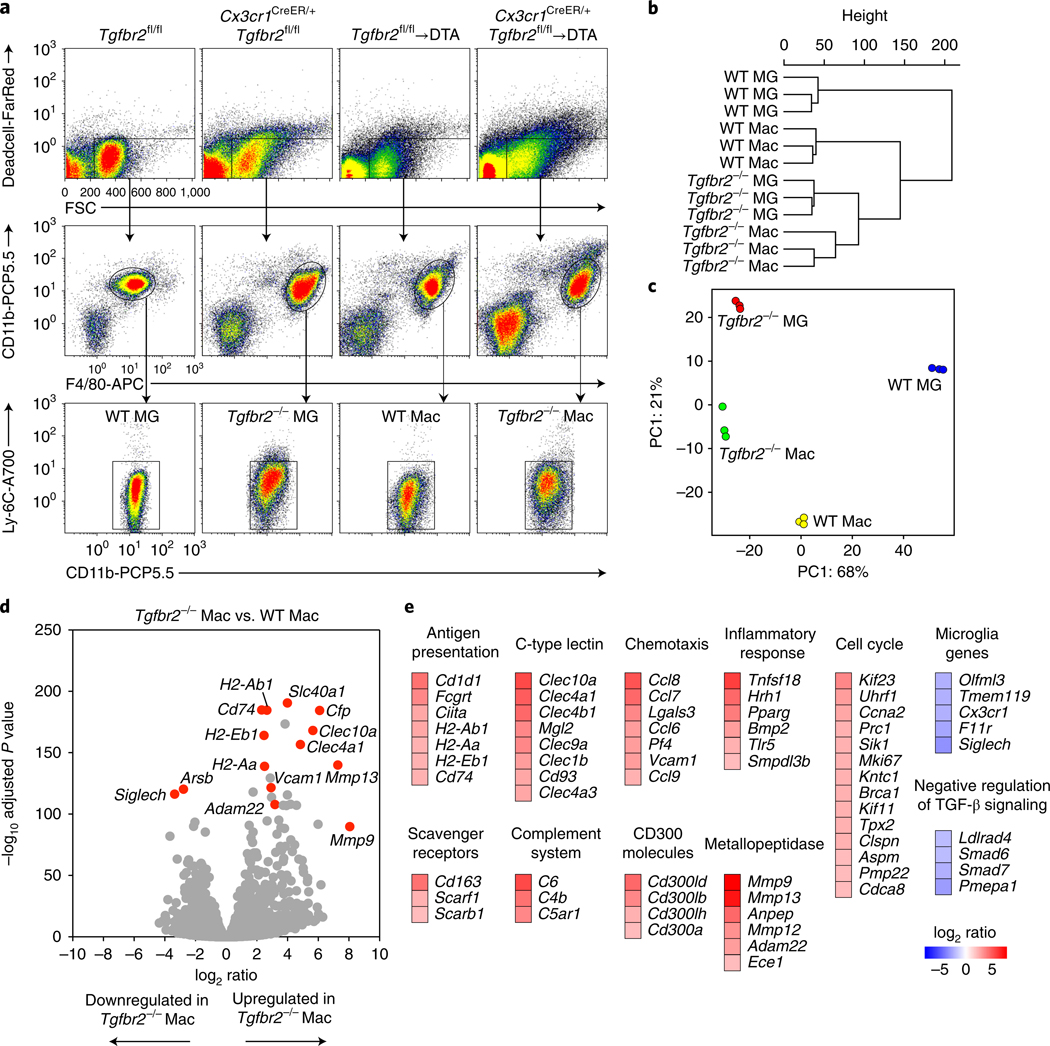
Fig. 4 |. Tgfbr2-deficient macrophages are characterized by expression of antigen presentation, inflammation and phagocytosis genes.
RNA-seq analysis of wild-type and Tgfbr2-deficient microglia (MG) and monocyte-derived macrophages (Mac), sorted from the CNS on days 18–22 after TAM administration. a, n = 3 samples per group, sorted from a pool of 1 (WT MG), 2 (Tgfbr2−/− MG), 2 or 3 (WT Mac) or 2–4 (Tgfbr2−/− Mac) mice per sample. b,c, Unbiased hierarchical clustering (b) and principal component (PC) analysis (visualizing 89% of variance; c) of DESeq2-normalized data from n = 3 samples per group. d, Volcano plots of DESeq2-normalized RNA-seq data visualizing the log2 ratio versus –log10 adjusted P value (Tgfbr2−/− Mac/WT Mac) of n = 3 samples per group. e, Expression (log2 ratio) of selected genes differentially expressed between Tgfbr2–/– macrophages and wild-type macrophages, clustered according to their pathways.

