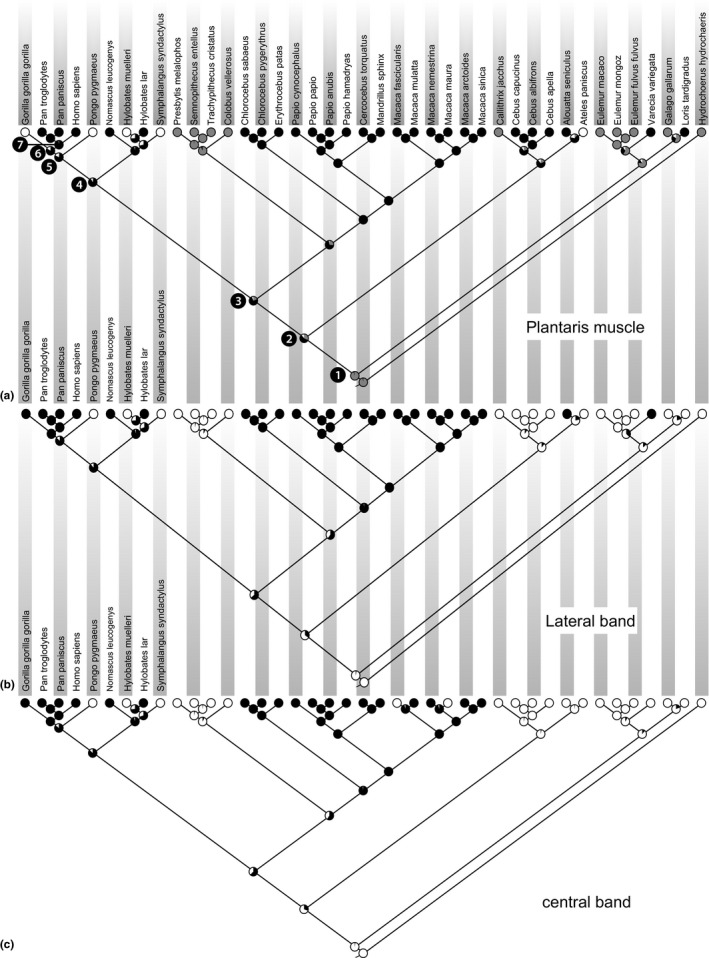
Figure 5.

Ancestral state reconstruction to find the ancestral states for plantaris muscle (a), lateral band (b) and central band (c) of the planar aponeurosis. The absence (white dot) or presence (black or grey dot) of three key characters was documented for each taxon. For each ancestral node (pie chart) the reconstruction finds the state assignment that maximizes the probability of arriving at the observed states in the terminal taxa. Black numbered dots represent last common ancestors of: all primates (1), all haplorhines (2), all catarrhines (3), all apes (4), great apes (5), African apes (6), and Pan/Homo (7).
