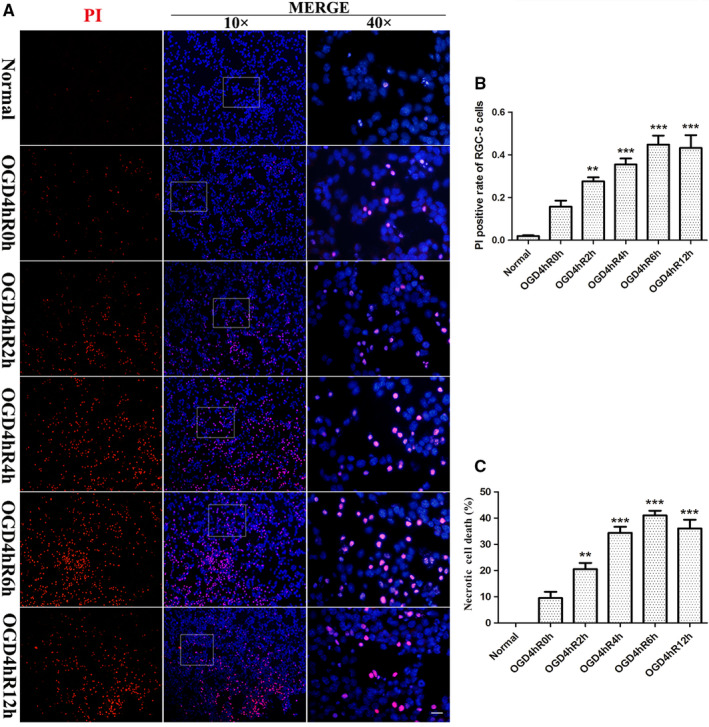
Figure 1.

Necrotic RGC‐5 was determined by PI staining and LDH release assay after OGD injury. (a) PI (red) staining of RGC‐5 after OGD injury. Nuclei were counterstained with DAPI (blue). The Scale bars: 40 µm (all images on the left and middle bar); 10 µm (all panels on the right bar). (b) The statistical analysis of PI/DAPI staining of necrotic cells. **p < .01 vs. normal group; ***p < .001 vs. normal group. (c) The percentage of RGC‐5 necrosis was determined by LDH release assay. **p < .01 vs. normal or OGD 4 hr/R 0 hr; ***p < .001 vs. normal or OGD 4 hr/R 0 hr
