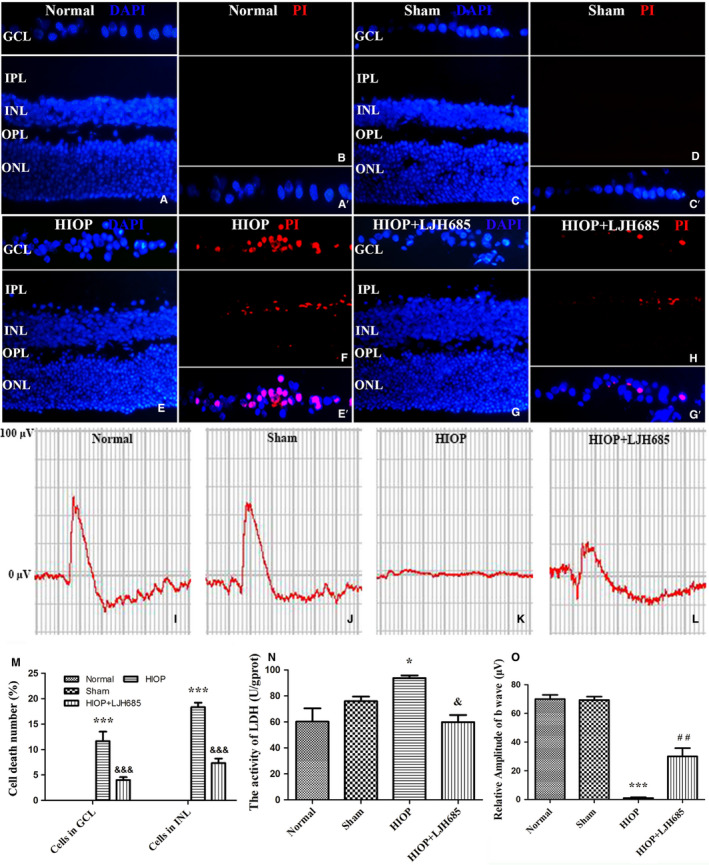
Figure 9.

RSK3 regulated necroptosis in retinal GCL and INL following HIOP in vivo. (a–h) PI (red, necrotic neurons)/DAPI (blue) double staining in rat retina. GCL, ganglion cell layer; INL, inner nuclear layer; IPL, inner plexiform layer; ONL, outer nuclear layer; OPL, outer plexiform layer; Sham, a sham operation group. Scale bar: 20 μm (all panels). LJH685 inhibitor and PI reagent were injected through the vitreous cavity in rat eye. (a′,c′,e′,g′) The framed areas show merged nuclei and PI staining in the GCL as indicated. (i–l) Representative fERG results. (m) Quantitative analysis of PI‐stained cells in GCL and INL of retina. ***vs. normal group, p < .001; &&&vs. HIOP group, p < .001. (n) The percentage of necrotic cells was determined by LDH release assay. *vs. normal group, p < .05; &vs. HIOP group, p < .05. (o) Quantitative analysis of the amplitudes of b‐wave. ***vs. normal group, p < .001; ##vs. HIOP group, p < .01
