Fig. 4.
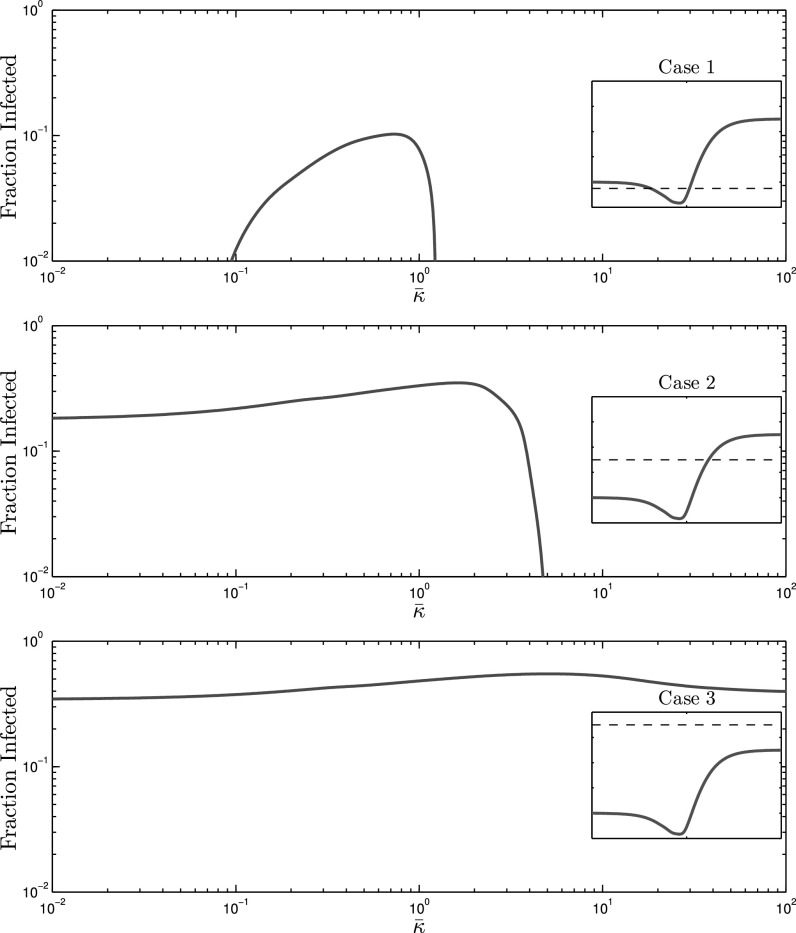
The effect of alerting rate on infection size for the undershooting scenario, for which the epidemic threshold dependence on  is depicted by the red curve in Fig. 3. Case 1 (top) Despite setting the effective infection rate below that of the extreme cases, i.e.,
  , an epidemic outbreak is still observed for small alerting rates because
  is larger than the minimum of
  . case 2 (middle) Effective infection rate lies in between the two extreme values, i.e.,
  . There is a slight increase in infected individuals after which the infection size drops to 0 due to the increase in the critical threshold. Case 3 (bottom) Persistent infections are observed regardless of contact adaptation rate because
  for all
  .
.

