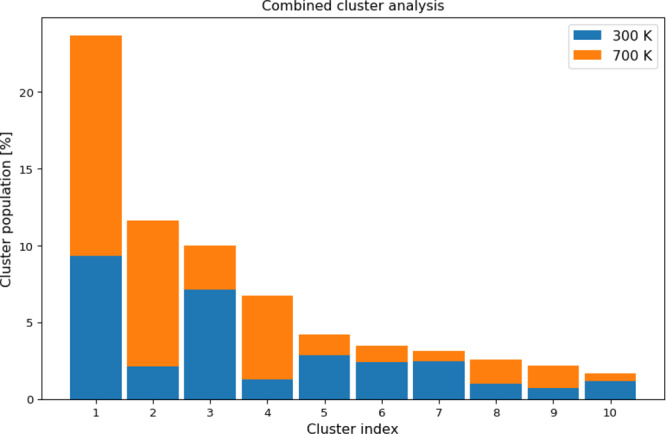
Figure 2.

Clustering of the combined trajectories of the system at 300 K and rotationally heated to 700 K. The plot shows the population counts per cluster and the relative portion of structures per cluster that belong to the trajectory at lower (blue) or higher temperature (orange).
