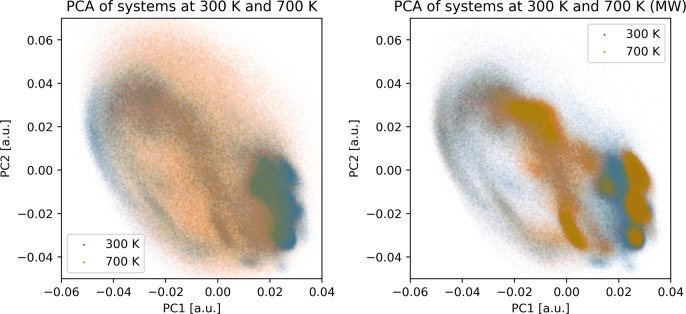
Figure 4.
Principal component analysis of the combined clustering of systems at equilibrium temperature of 300 K, conventionally heated to 700 K and MW heated to 700 K. The first and second principal components form the x and y axes of the scatter plots, respectively. On each plot, the trajectory at equilibrium 300 K is depicted with blue dots and the trajectory at an elevated temperature is depicted with orange dots.

