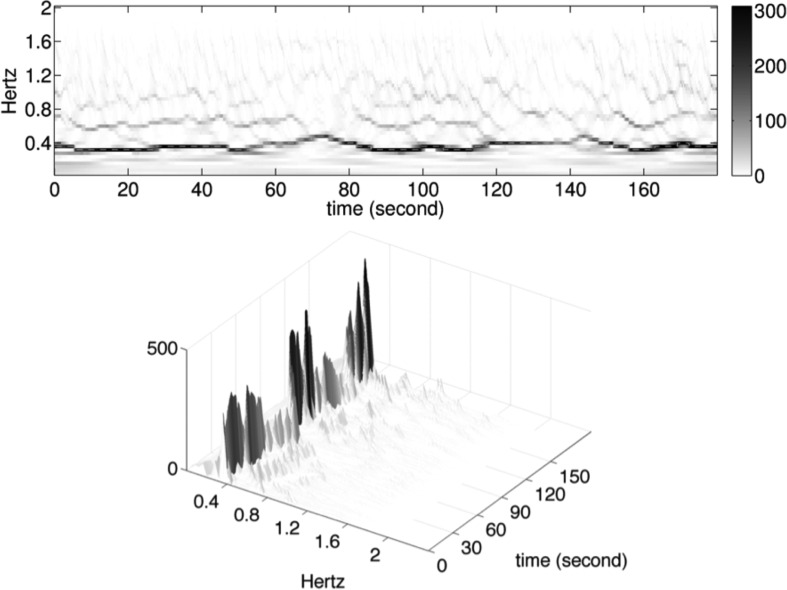
Fig. 3.
Top row: the result of the Synchrosqueezing transform (SST) of the signal in Fig. 1 with the SSTIF (dashed curve) superimposed; bottom row: the 3-D version of the SST result. The instantaneous frequency corresponds to the dominant curve in the SST, and the amplitude modulation corresponds to the intensity upon the dominant curve (visible in the 3-D graph). Indeed, the spacing of respiration cycle is reflected by SSTIF: closer spacing corresponds to higher SSTIF values, and wider spacing to lower SSTIF values; the darker curve corresponds to higher SSTAM values, and lighter curve to lower SSTAM values. In conclusion, through reading the SST figure, we can visually see how the frequency and amplitude modulation vary according to time.

