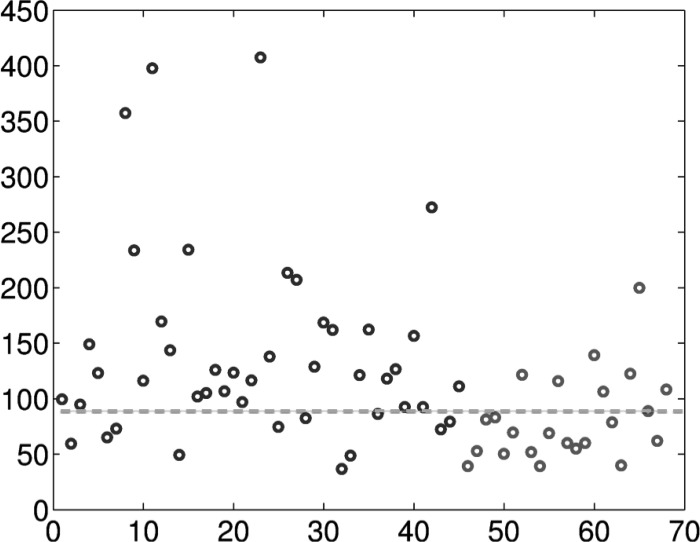
Fig. 5.
WIN indices of the  patients. The black circles are the WIN indices for the patients who succeeded in the weaning procedure (numbered
  to
to  here), while the gray circles are for the patients who failed in the weaning procedure (numbered
  to
to  here). The gray dashed line is the cut-off value
  determined by the ROC.

