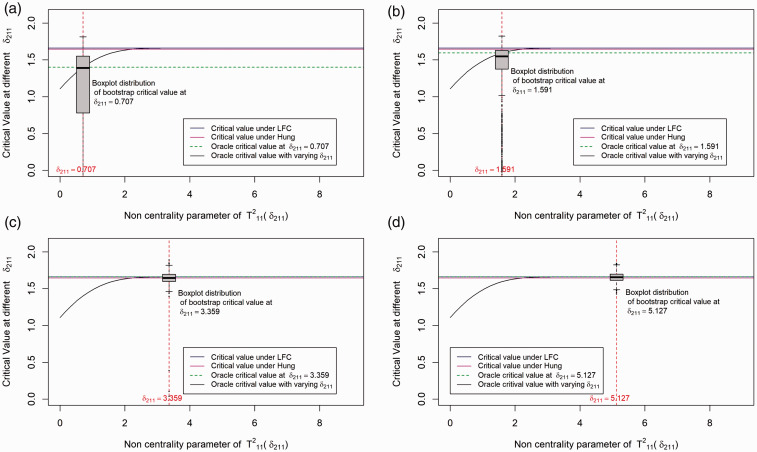
Figure 2.
Distribution of critical value for the different methods under the set up: Drug A and Drug B both have one active dose group with sample size per dose group=25. The first effect size (δ1) is 0 and the second effect size (δ2) varies. Note that is addressed as in the article and the plots are shown in terms of the non-centrality parameter of test statistics , i.e. , which is the second effect size scaled by the harmonic sum of sample size of the dose combination and the second monotherapy. (a) Boxplot distribution at δ211 = 0.707; (b) boxplot distribution at δ211 = 1.591; (c) boxplot distribution at δ211 = 3.359; (d) boxplot distribution at δ211 = 5.127.

