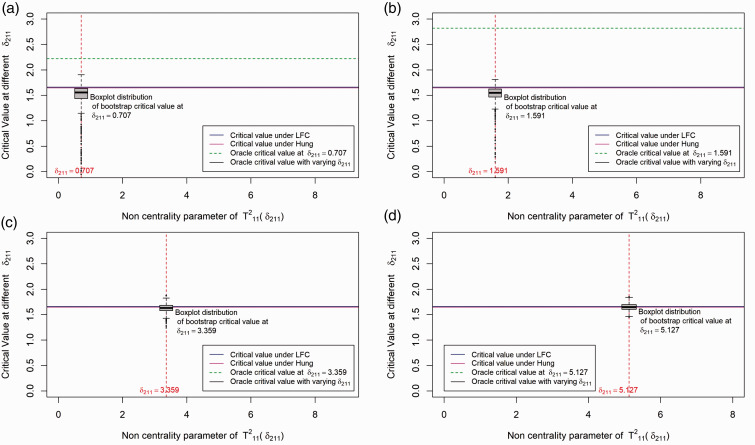
Figure 3.
Distribution of critical value for the different methods under the set-up: Drug A and Drug B both have one active dose group with sample size per dose group = 25. The first effect size (δ1) is 0.5 and the second effect size (δ2) varies along X-axis. Note that is addressed as in the article and the plots are shown in terms of the non-centrality parameter of test statistics , i.e. , which is the second effect size scaled by the harmonic sum of sample size of the dose combination and the second monotherapy. This plot is provided to analyze the empirical power performance of the different methods. (a) Boxplot distribution at δ211 = 0.707; (b) boxplot distribution at δ211 = 1.591; (c) boxplot distribution at δ211 = 3.359; (d) boxplot distribution at δ211 = 5.127.

