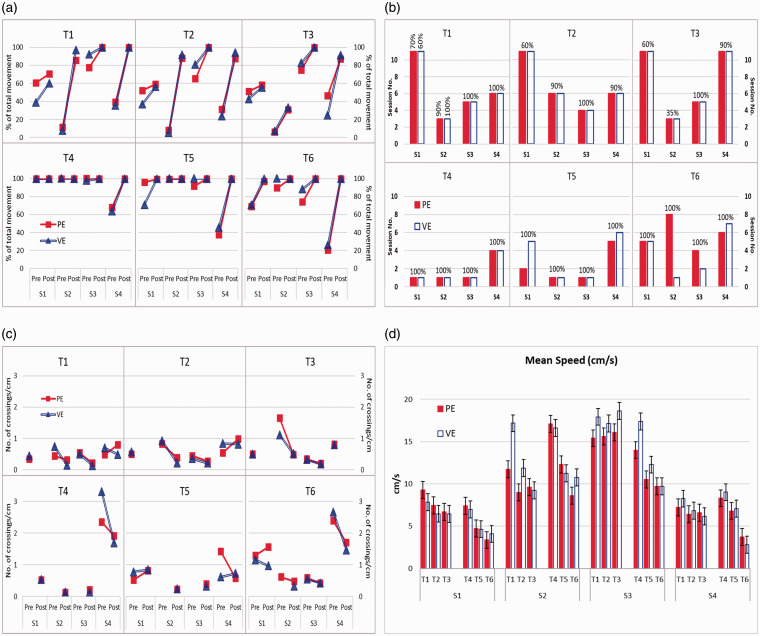
Figure 3.
(a) Changes in subjects’ self-movement in reaching between session 1 (Pre) and session 10 (Post). (b) The session number that each subject reached their self-movement plateau during the 10 sessions of reaching practice; subject’s self-movement following plateau is indicated. Values more than 10 sessions indicate that the plateau was not reached. (c) Changes in the shakiness measure between the plateau session (marked as Pre) and the last session (marked as Post). At those that plateau was not reached only the shakiness measure of the last (10th) session is shown on Pre value. At those that plateau was reached right at the first session, the shakiness measure of the last (10th) session is shown on Post value. (d) Difference in Mean Speed between targets for each subject in both environments. The error bars show standard deviation. S1–S4 indicate subject IDs. T1–T6 indicate target numbers. PE and VE represent Physical and Virtual environments.

