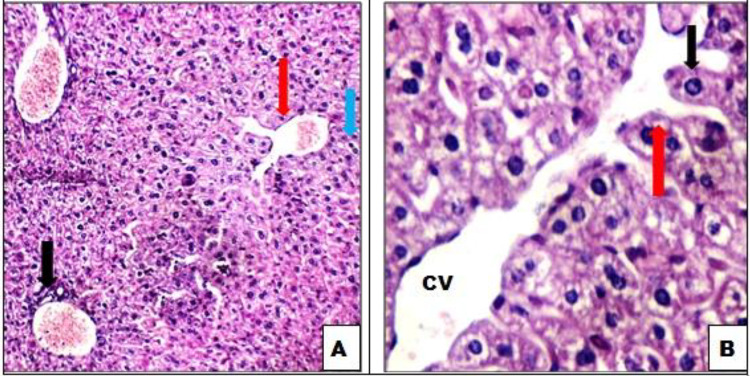
Figure 1.
A, control mice liver tissue showing average portal tract (black arrow), average central vein (red arrow), and average hepatocytes (blue arrow; hemotoxylin and eosin ×200). B, Average central vein (CV) and average hepatocytes arranged in single-cell cords (black arrow) with average intervening blood sinusoids (red arrow; hemotoxylin and eosin ×400).

