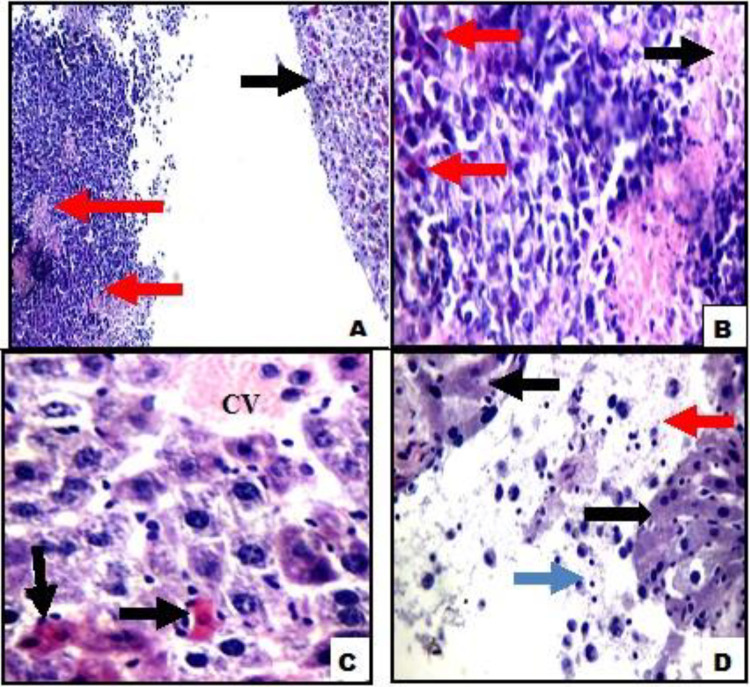
Figure 4.
A, Liver tissue of Ehrlich ascites carcinoma (EAC) + T gondii showing markedly apoptotic cells (black arrows) with surrounding tumor tissue showing areas of necrosis (red arrows; hemotoxylin and eosin ×200). B, High power view showing tumor tissue with areas of necrosis showing karyorrhectic fragments (black arrows) and apoptotic tumor cells (red arrows). C, Another view showing average central vein (CV) with surrounding markedly apoptotic hepatocytes (black arrows). D, Another view showing liver tissue (black arrows), with surrounding markedly necrotic tumor tissue (red arrows) with inflammatory infiltrate (blue arrows; B-D hemotoxylin and eosin ×400).

