Figure 5.
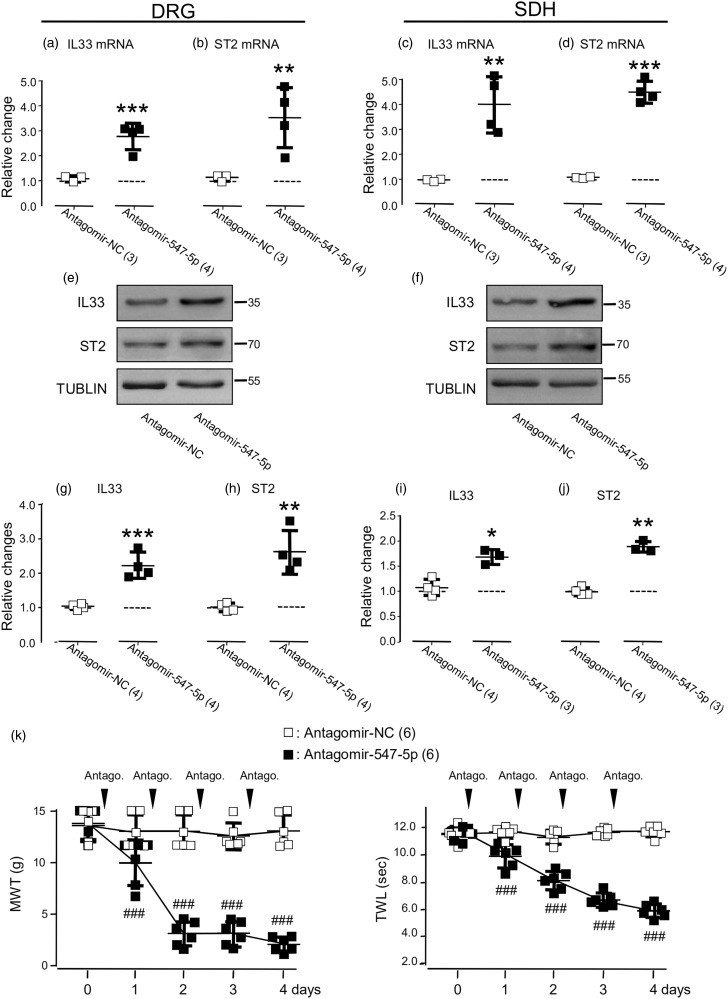
Effects of the i.t. administration of antagomir-miR-547-5p (antagomir-547-5p, 20 µM) on IL-33 (IL33) and ST2. The left graphs of (a) and (c): Summary data (mean ± SD) showing the expression of IL-33 mRNA normalized to that in naive rats (= 1, dashed line). The right graphs of (a) and (c): Summary data (mean ± SD) showing the expression of IL-33 mRNAs normalized to that in rats that received antagomir-NC (20 µM, = 1, dashed line, see Supplementary Figure 4(a)). The left graphs of (b) and (d): Summary data (mean ± SD) showing the expression of ST2 mRNA normalized to that in naive rats (= 1, dashed line). The right graphs in (b) and (d) show the expression of ST2 mRNAs normalized to that in rats that received the i.t. administration of antagomir-NC (= 1, dashed line). (e) and (f) Examples of Western blots. Gels (from left to right) in (e) and (f) were respectively loaded with lysates prepared from the right L4 to L6 DRG (e) and SDH (f) of rats that received the i.t. administration of antagomir-NC and antagomir-547-5p. Each group of the blots was stripped and successively probed with antibodies as indicated on the left of blots. Values on the right side of the blots indicate the molecular mass (Kd). The ratio of band intensities versus that of tublin was calculated. The left graphs in (g) to (j) show normalized ratios to that in naive animals (= 1, dashed line, also see the left blot groups in Figure 4(i) and (j)). The right graphs in (g) to (j) show normalized ratios to that in rats that received the i.t. administration of antagomir-NC (= 1, dashed line). *p < 0.05, **p < 0.01, ***p < 0.001, unpaired t test in comparison between effects of i.t. antagomir-547-5p versus antagomir-NC administration. (k) Summary data (mean ± SD) showing the effects of the i.t. administration of antagomir-NC (20 µM) or antagomir-547-5p (20 µM) once daily for four consecutive days on the MWT and TWL of rats. The black arrowheads indicate the i.t. infusion of antagomir-NC or antagomir-547-5p. Values in brackets indicate the number of rats tested.
DRG: dorsal root ganglia; SDH: spinal dorsal horn; IL33: interleukin-33; ST2: suppressor of tumorigenicity 2; NC: nonspecific negative control sequence; miRNA: microRNA; MWT: mechanical withdrawal threshold; TWL: thermal withdrawal latency.

