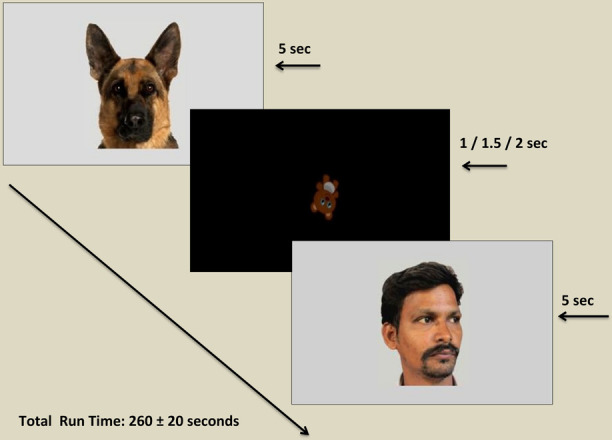
FIGURE 1.

Diagram illustrating stimulus presentation within the eye tracking paradigm. Each target stimulus was displayed for a period of 5 s (5000 ms) followed by an inter-stimulus image displayed for a variable period of 1, 1.5, or 2 s. Permissions and image licenses have been obtained from the copyright holders (Source: ©Eric Isselee/Shutterstock.com).
