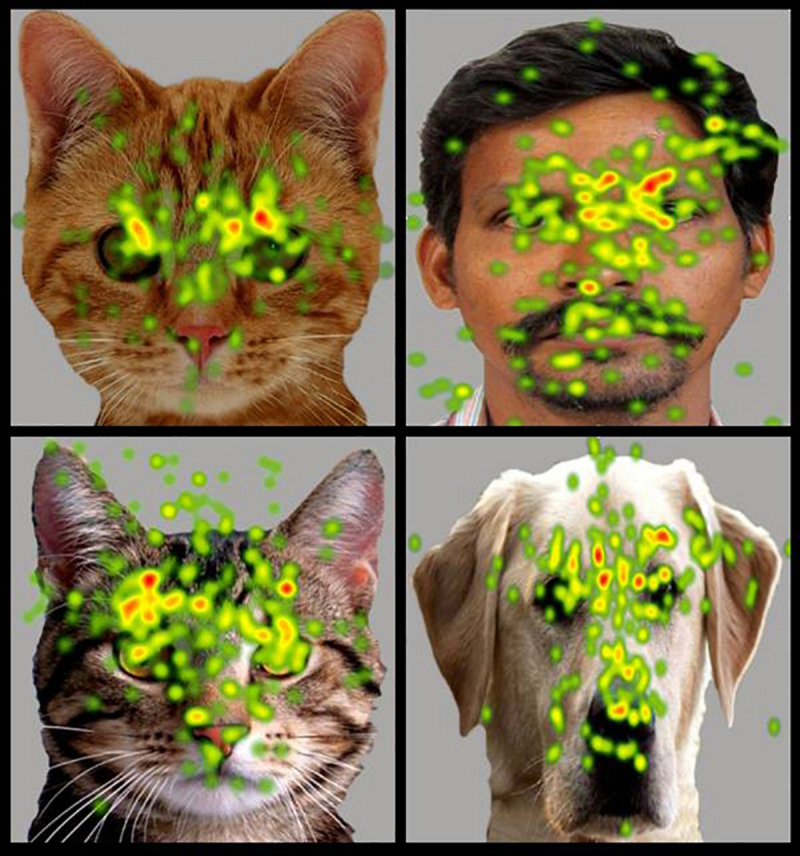
FIGURE 5.

Heat Diagram illustrating the most attended areas of the human and animal faces by ASD participants and indicating the greater visual attention to salient regions of the animal face in ASD. (Gradients of most attended areas on the heat maps range from red through yellow to green).
