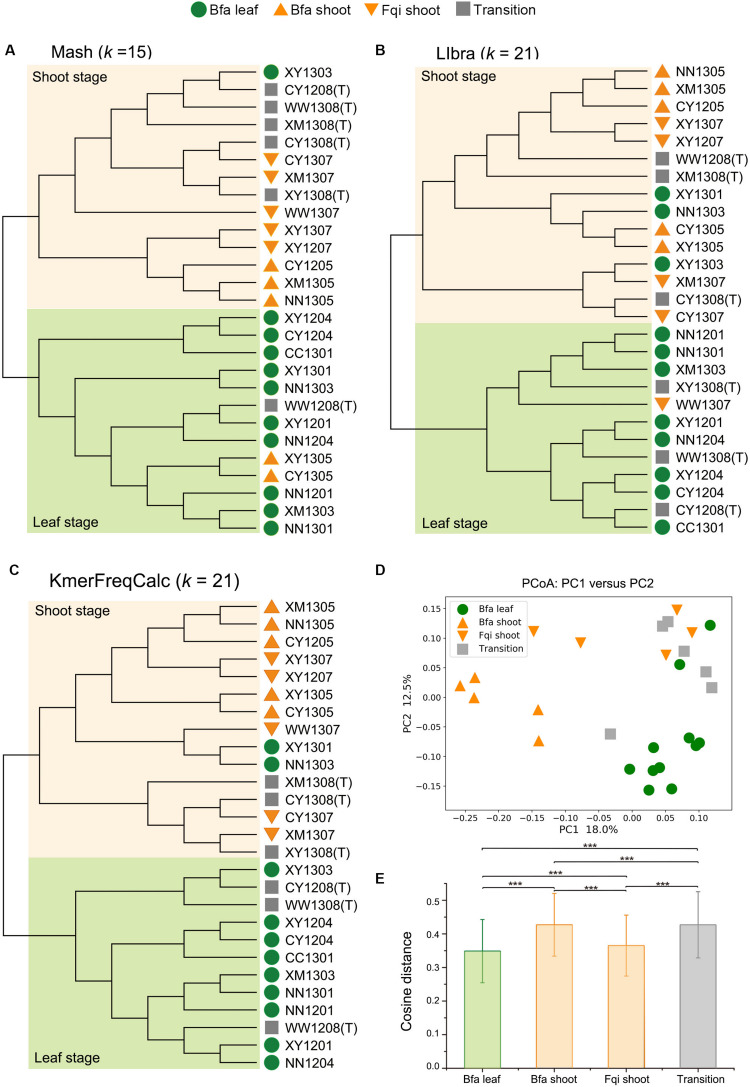
FIGURE 2.
Whole metagenome comparisons of samples in QIN dataset using Mash, Libra and KmerFreqCalc. In NJ tree, two clades of the shoot stage and leaf stage are highlighted with lightorange and lightgreen, respectively. The diet stages are indicated by green circles (Bfa leaf), orange regular triangles (Bfa shoot), orange inverted triangles (Fqi shoot) and gray squares (Transition). (A) NJ tree based on the distance calculated by Mash (k = 15). (B) NJ tree based on the distance calculated by Libra (k = 21). (C) NJ tree based on the distance calculated by KmerFreqCalc (k = 21). (D) PCoA analysis using the cosine distance calculated by KmerFreqCalc (k = 21). (E) Variations in different stages (Bfa leaf, Bfa shoot, Fqi shoot and transition) were determined by cosine distance calculated by KmerFreqCalc (k = 21). Mean values ± standard errors of the means are shown. ***p < 0.001 (Rank-sum test).

