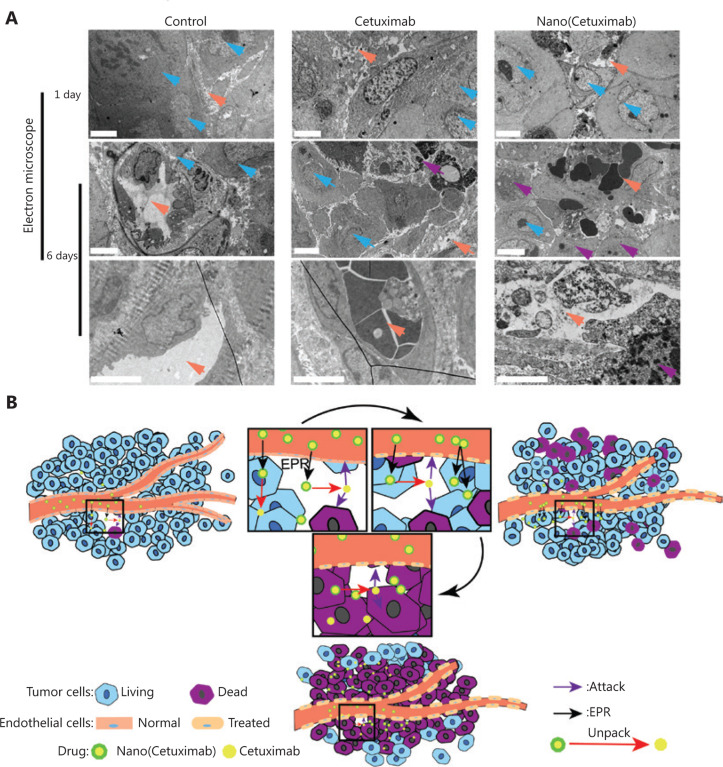
Figure 3.
(A) Electron microscopy analysis of the vasculature of tumors at 1 and 6 days after the administration of native cetuximab and Nano(cetuximab). Orange represents the vessel lumen, blue represents tumor cells, and purple represents apoptotic tumor cells. Scale bar: 4 μm. (B) A potential schematic illustration of the working mechanism of Nano(cetuximab).

