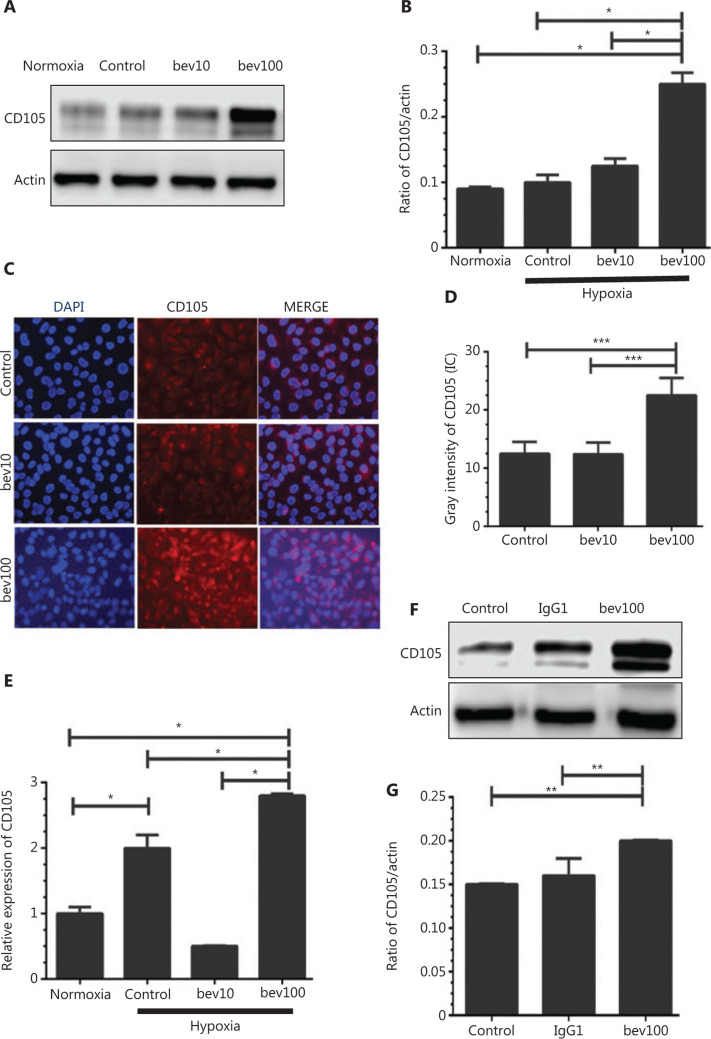
Figure 3.
High concentration of bevacizumab (100 μg/mL) stimulates CD105 expression. (A) Western blot showing changes in CD105 protein levels following bevacizumab treatment under normoxia and hypoxia conditions (control: bevacizumab 0 μg/mL, bev10: bevacizumab 10 μg/mL, bev100: bevacizumab 100 μg/mL; normoxia: normal oxygen vehicle). (B) Quantitative analysis of CD105 protein levels following bevacizumab treatment under hypoxia. Data represent mean ± SD, *P < 0.05; one-way ANOVA. (C) Immunofluorescence of CD105 in HUVECs pre-stimulated with bevacizumab under hypoxia (control: bevacizumab 0 μg/mL, bev10: bevacizumab 10 μg/mL, bev100: bevacizumab 100 μg/mL), CD105 (red), and DAPI (blue). Magnification, ×200. (D) Quantitative analysis of fluorescence intensity of CD105+, ***P < 0.001; one-way ANOVA. (E) Changes in CD105 mRNA levels in response to bevacizumab under hypoxia conditions. Data represent mean ± SD, *P < 0.05; one-way ANOVA. (F) Western blot showing CD105 expression upon treatment with 100 μg/mL bevacizumab and isotype control IgG1 under hypoxia. (G) Quantitative analysis of CD105 protein expression following bevacizumab (100 μg/mL) and isotype control (IgG1) treatment. Data represent mean ± SD, **P < 0.01; one-way ANOVA.

