Figure 5.
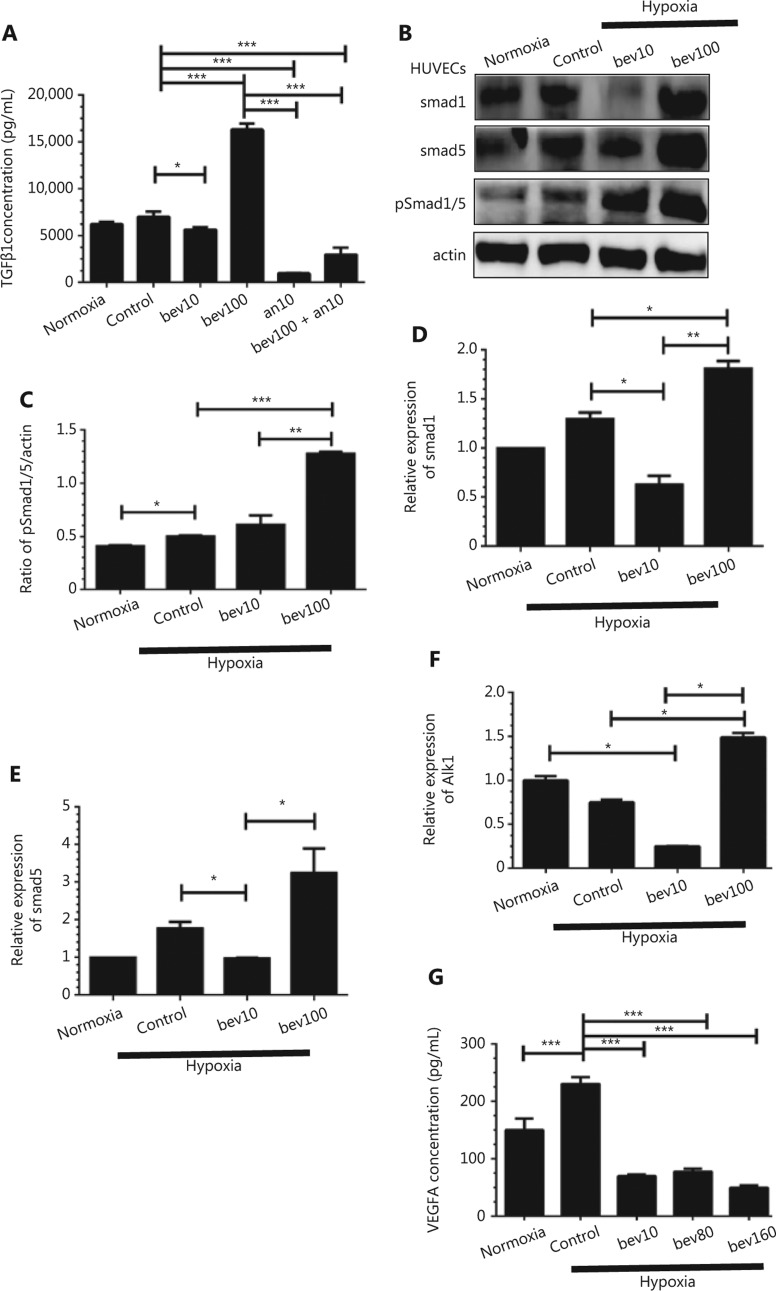
The TGFβ pathway is activated by high concentration of bevacizumab (100 μg/mL) under hypoxia conditions. (A) Concentrations of secreted TGFβ1 in supernatant determined using ELISA under hypoxia. HUVECs were treated with 10 and 100 μg/mL bevacizumab (24 h), anlotinib 10 μM (24 h), bevacizumab (100 μg/mL for 8 h) and anlotinib (10 μM for 16 h) sequentially; normoxia: normal oxygen vehicle. *P < 0.05; ***P < 0.001, one-way ANOVA. (B) Western blot showing changes in Smad1, Smad5, and pSmad1/5 protein levels (downstream factor of TGFβ and CD105) following bevacizumab treatment under hypoxia. (C) Quantitative analysis of pSmad1/5 protein levels following bevacizumab treatment. Data represent mean ± SD, *P < 0.05, **P < 0.01, ***P < 0.001; one-way ANOVA. (D–F) Quantitative analysis of Smad1, Smad5, and alk1 mRNA levels following treatment with bevacizumab under hypoxia, *P < 0.05, **P < 0.01, ***P < 0.001; one-way ANOVA. (G) Concentrations of secreted VEGFA in the supernatant under hypoxia, as determined with ELISA. HUVECs were treated with 10, 80, and 160 μg/mL bevacizumab (starvation for 12 h); normoxia: normal oxygen vehicle, *P < 0.05, **P < 0.01, ***P < 0.001; one-way ANOVA.

