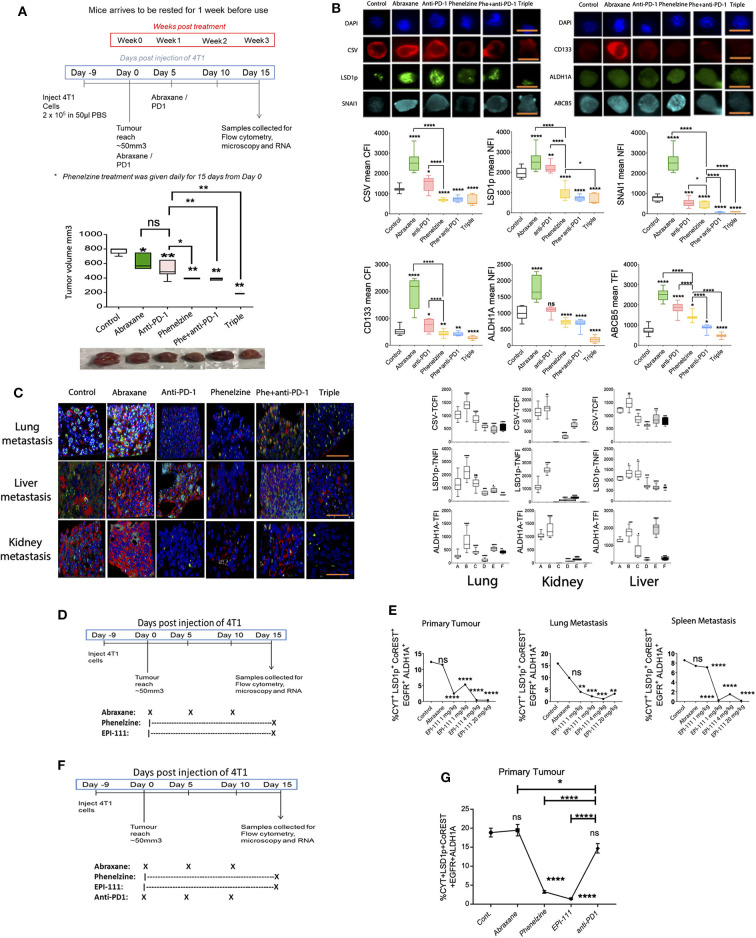
Figure 2.
Targeting LSD1's nuclear activity effectively inhibits mesenchymal marker expression in vivo. (A) 4T1 breast cancer treatment regimen and tumor volumes on day 15 post-treatment. Mann-Whitney test, *p < 0.02, **p < 0.008. Treatment groups from left to right. Control, Abraxane (30 mg/kg), anti-PD-1 (10 mg/kg), phenelzine (40 mg/kg), phenelzine + anti-PD-1, and triple (Abraxane + phenelzine + anti-PD-1). (B) Cancer cells were isolated from a 4T1 TNBC immunotherapy-resistant mouse model treated as in 2A and labeled with primary antibodies against LSD1s111p, CSV, and SNAIL or CD133, ALDH1A, and ABCB5. The TNFI for LSD1, SNAIL, and ALDH1A, TCFI for CSV and CD133, and the TFI for ABCB5 were measured using ImageJ (n > 20 cells/group). Graphs plot the TNFI of LSD1, SNAIL, ALDH1A; TCFI of CSV, CD133; and TFI of ABCB5. Mann-Whitney test, ****p < 0.0001, ***p = 0.0002, **p = 0.0021, *p = 0.033, ns > 0.05. Representative images are shown with scale bar equal to 10 mm. Group A = control, Group B = abraxane, Group C = anti-PD1, Group D = phenelzine, Group E = phenelzine + anti-PD-1, and Group F = triple (PD-1 + phenelzine + abraxane). (C) FFPE sections were taken from primary tumors and lung, liver, and kidney metastases from a 4T1 TNBC immunotherapy-resistant mouse model treated as in 2A and labeled with primary antibodies against LSD1s111p, CSV, and ALDH1A. The TNFI for LSD1 and ALDH1A and TCFI for CSV were measured using ImageJ (n > 20 cells/group). Graphs plot the TNFI of LSD1, ALDH1A and TCFI of CSV. Mann-Whitney test, ****p < 0.0001, ***p = 0.0002, **p = 0.0021, *p = 0.033, ns > 0.05. Representative images are shown with scale bar equal to 30 mm. Group A = control, Group B = abraxane, Group C = anti-PD1, Group D = phenelzine, Group E = phenelzine + anti-PD-1, and Group F = triple (PD-1 + phenelzine + Abraxane). (D) 4T1 breast cancer treatment regimen. Treatment groups from left to right. Control, Abraxane (30 mg/kg), phenelzine (40 mg/kg), EPI-111 (1 mg/kg), EPI-111 (4 mg/kg), and EPI-111 (20 mg/kg). (E) FFPE sections were taken from primary tumors and lung and spleen metastases from a 4T1 TNBC immunotherapy-resistant mouse model treated as in 2D and labeled with primary antibodies against LSD1s111p, cytokeratin (CYT), CoREST, EGFR, and ALDH1A. The cancer cell population positive for these markers was analyzed using the ASI digital pathology system to enumerate % total cell population. Graphs plot the % cell population for each group (N > 500 cells a group). Mann-Whitney test, ****p < 0.0001, ***p = 0.0002, **p = 0.0021, *p = 0.033, ns > 0.05. Treatment groups are control, abraxane (30 mg/kg), phenelzine (40 mg/kg), EPI-111 (1 mg/kg), EPI-111 (4 mg/kg), and EPI-111 (20 mg/kg), with 5 mice per group. (F) 4T1 breast cancer treatment regimen. Treatment groups from left to right: control, abraxane (30 mg/kg), phenelzine (40 mg/kg), EPI-111 (4 mg/kg), and anti-PD1 (10 mg/kg), with 5 mice per group. (G) FFPE sections were taken from primary tumors from the 4T1 TNBC immunotherapy-resistant mouse model treated as in 2D and labeled with primary antibodies against cytokeratin, LSD1p, CoREST, EGFR, and ALDH1A. The cancer cells positive for these markers were analyzed using the ASI Digital Pathology System to enumerate % total cell population. Graphs plot the % cell population for each group (n>500 cells per group; n = 5 mice per group). Mann-Whitney test, ****p < 0.0001, ***p = 0.0002, **p = 0.0021, *p = 0.033, ns > 0.05.

