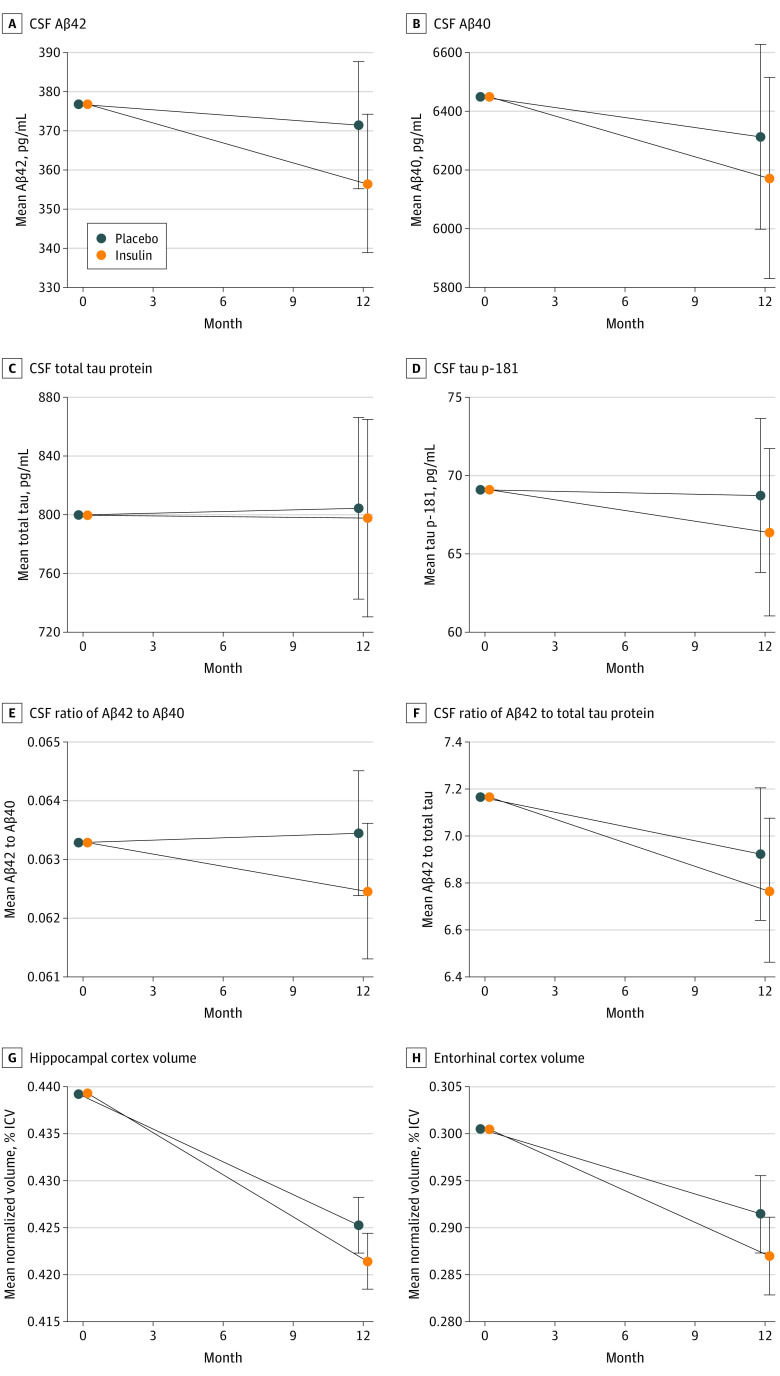
Figure 3. Mean Change in Cerebrospinal Fluid and Neuroimaging Biomarkers From Baseline to Month 12 for the Primary (Device 2) Cohort.
The linear mixed-effects model used fixed effects for time from baseline as a continuous variable, and treatment-by-time interactions, sex, age, baseline score on the Mini-Mental State Examination, and apolipoprotein E ε4 allele carriage status as covariates. Aβ indicates amyloid beta; CSF, cerebrospinal fluid; ICV, intracerebroventricular volume; and tau p-181, tau phosphorylated at threonine 181. Error bars indicate 95% CIs.

