
Figure 1. Prevalence of Mycoplasma genitalium, Stratified by Other Sexually Transmitted Infections.
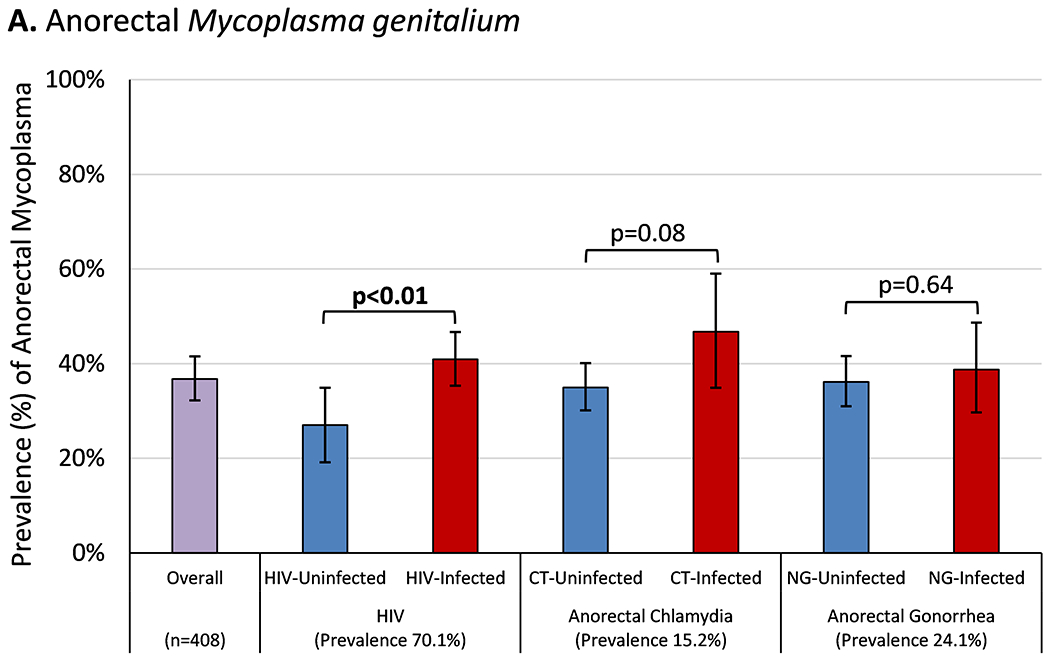
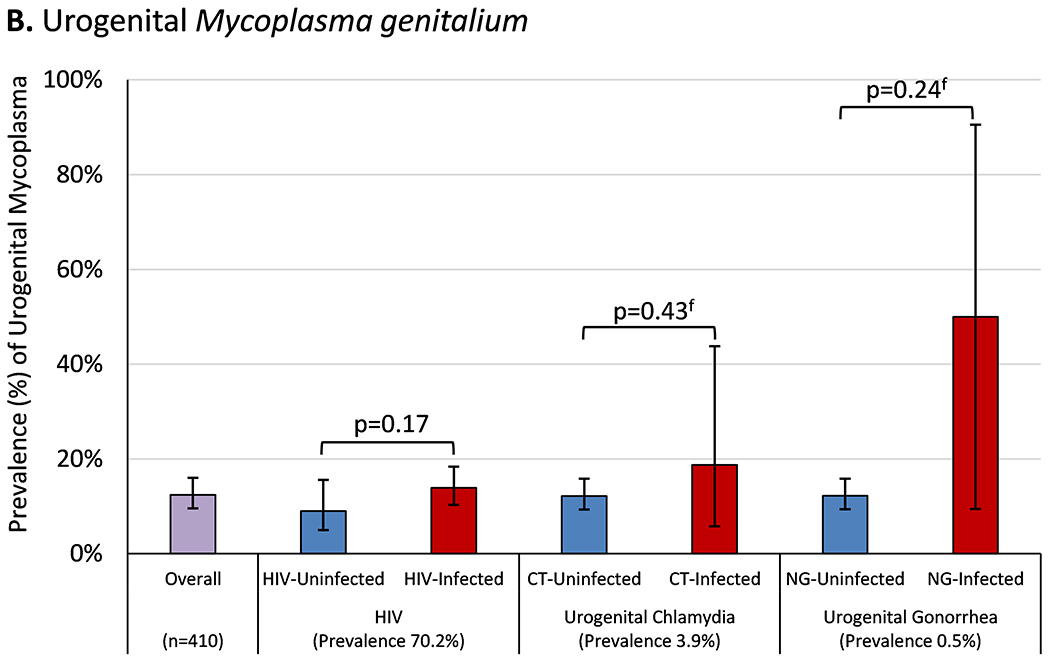
Bar height represents the percentage of study participants diagnosed with (A) anorectal or (B) urogenital Mycoplasma genitalium on the first tested specimen, stratified by the presence or absence of co-infection with other sexually transmitted infections. Error bars represent Wald 95% confidence intervals. Comparisons between participants with and without each co-infection were made using Student’s t-test or Fisher’s exact test (for rare events, indicated by f) with statistically significant p-values (p≤0.05) shown in bold. The prevalence of each sexually transmitted infection was calculated by dividing the number of cases detected by the total number of participants retrospectively tested for Mycoplasma genitalium at each anatomic site.
Abbreviations: HIV, human immunodeficiency virus; CT, Chlamydia trachomatis; NG, Neisseria gonorrhoeae