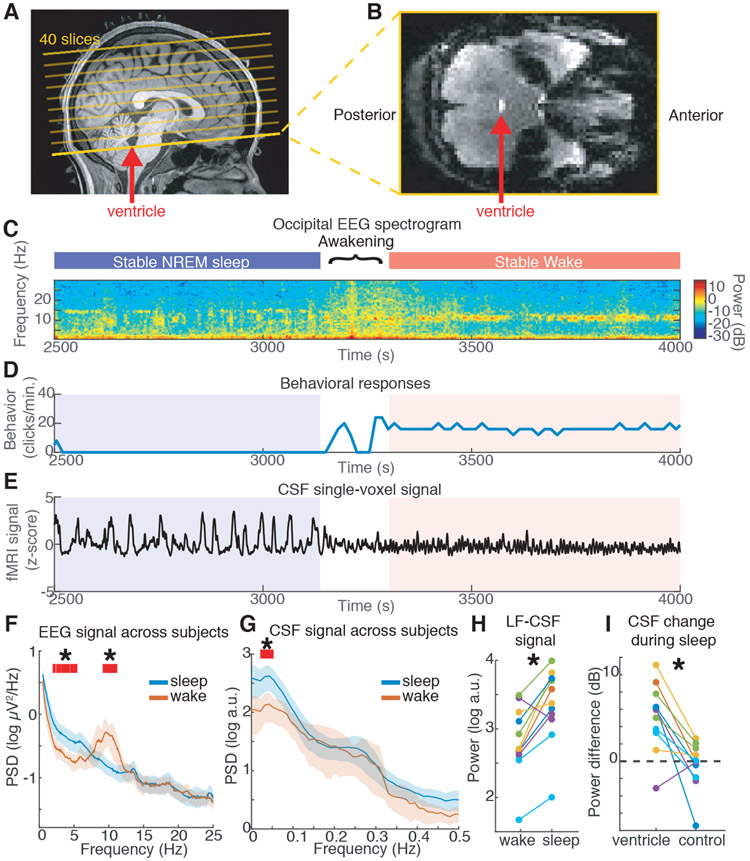
Fig. 1: Large oscillations in CSF signals appear in the fourth ventricle during sleep.
A) Example scan positioning. Thick yellow line: position of the functional image relative to the anatomy. The bottom edge intersects with the fourth ventricle (red arrow), allowing CSF inflow to be measured. A subset of the 40 acquired slices are displayed. B) Example functional image from the bottom slice: inflow through the ventricle is detected as a bright signal (red arrow). C) EEG spectrogram from this subject shows long periods of NREM sleep and wake (~10 Hz occipital alpha). D) Behavioral responses from this subject. E) Timeseries of a single CSF voxel (smoothed with 10-TR kernel) shows large slow dynamics in sleep, that subside during wakefulness. F) Mean power spectral density (PSD) of occipital EEG confirms slow-delta power in sleep, as opposed to high alpha power in wake (n=13 subjects sleep; 11 subjects wake). G) PSD of CSF signal shows increased 0.05 Hz power during sleep (n=13 subjects sleep; 11 subjects wake). Shaded region is 95% CIs; red lines and star mark non-overlapping CIs. H) Low-frequency (LF, 0–0.1 Hz) CSF power increased during sleep (n=11 subjects for pairwise comparison). I) This sleep-selective power increase was specific to the ventricle ROI and not observed in a neighboring size-matched control ROI (n=11 subjects).

