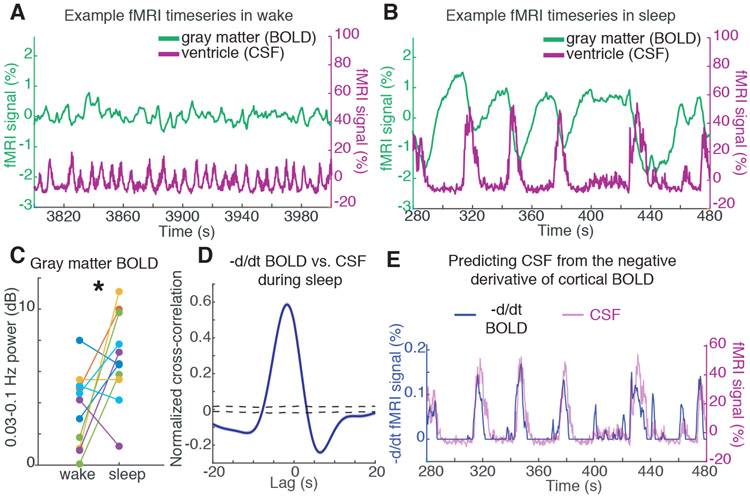
Fig. 3: CSF flow oscillations are anticorrelated to a hemodynamic oscillation in the cortical gray matter that appears during sleep, with CSF flow increasing when blood volume decreases.
A) Example timeseries of the cortical gray matter BOLD signal and the mean CSF signal from one subject. During wake, signals are low-amplitude and synchronized to respiration (0.25 Hz). B) During sleep, a large-amplitude BOLD oscillation appears, and its timecourse is coupled to the ventricle CSF signal (~0.05 Hz). C) The mean cortical gray matter BOLD signal power increases during sleep (n=11 subjects for pairwise test). D) The mean cross-correlation between the zero-thresholded negative derivative of BOLD and CSF signals shows strong correlation (n=176 segments, 13 subjects). Shaded blue is standard error across segments; black dashed line is 95% interval of shuffled distribution. E) Example timeseries showing the correlation, suggesting that CSF flows up the fourth ventricle when cerebral blood volume decreases.

