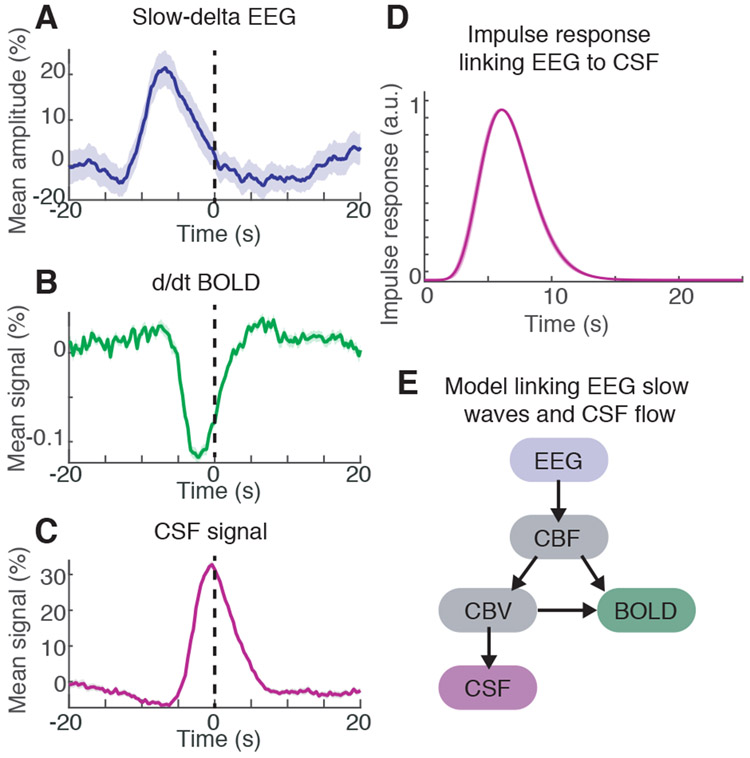
Fig. 4: EEG slow-delta waves are coupled to and precede BOLD and CSF oscillations.
A) The mean amplitude envelope of slow-delta EEG; B) mean derivative of BOLD; and C) mean CSF signal, all locked to the peaks of CSF waves during sleep. Shaded region is standard error across peak-locked trials (n=123 peaks). D) Calculated impulse response of the CSF signal to the EEG envelope shows a similar timecourse to previously established hemodynamic models. Shading is standard deviation across model folds. E) Diagram of model linking the timecourse of neural activity to CSF flow. Variables include cerebral blood flow (CBF) and cerebral blood volume (CBV).

