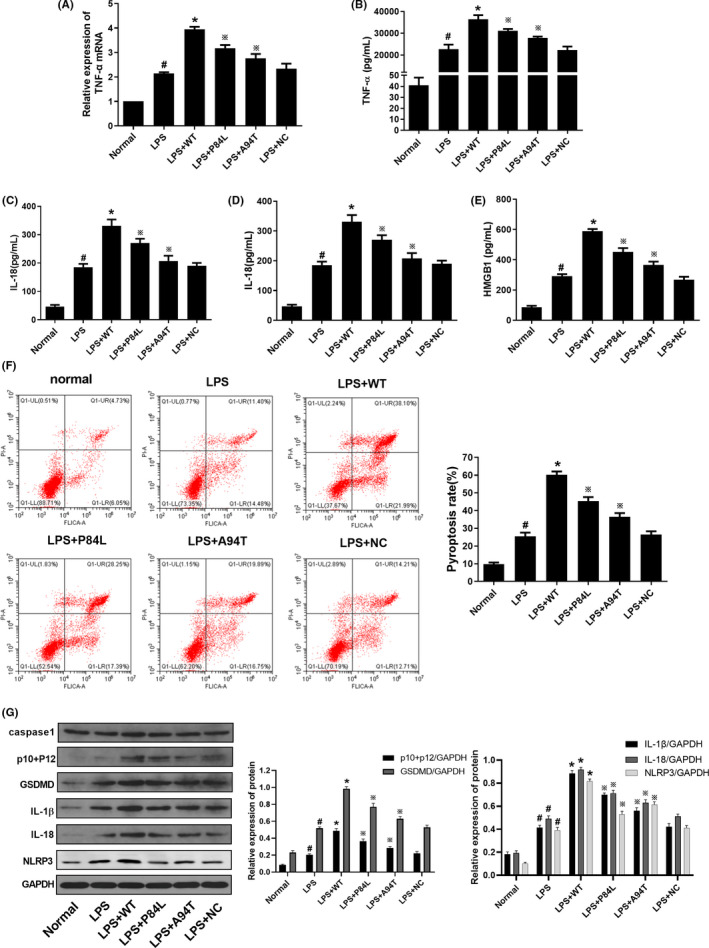
Figure 5.

TNF‐α SNPs decreased the expression of TNF‐α, IL‐1β and IL‐18 in M1 macrophages. A, mRNA levels of TNF‐α were detected by RT‐PCR. B‐E, Concentrations of TNF‐α, IL‐1β, IL‐18 and HMGB1 in cell supernatants were detected by ELISA. F, Pyroptosis rates were determined by flow cytometry. G, Protein levels of pro‐caspase‐1 + p10 + p12, GADMD, IL‐1β, IL‐18 and NLRP3 were detected by Western blotting. Data are shown as mean ± SD. n = 3. #P < .05, compared with the normal group. *P < .05, compared with the LPS group. ※P < .05, compared with the LPS + WT group
