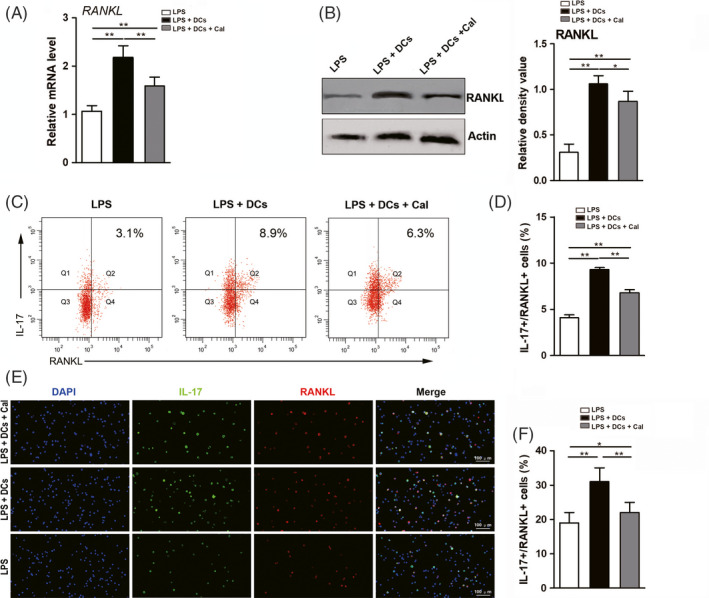
FIGURE 2.

Suppressive effect of calcitriol on RANKL expression in Th cells in an inflammatory environment. A, mRNA level of RANKL in Th cells (determined by qRT‐PCR) following incubations in various conditions (LPS group, LPS + DC group and LPS + DC + Cal group). B, Protein level of RANKL in Th cells (determined by Western blotting) following incubations in various conditions (LPS group, LPS + DC group and LPS + DC + Cal group; left panel) and semi‐quantitative analysis of the protein expression level (normalized to the level of actin) in terms of the relative grey density (right panel). C, Representative flow cytometry plots of IL‐17+/RANKL+ Th cells following incubations in various conditions (LPS group, LPS + DC group and LPS + DC + Cal group). D, Quantification of the proportion of IL‐17+/RANKL+ Th cells (assessed by flow cytometry). E, Representative immunofluorescence images of IL‐17+/RANKL+ Th cells (cell nucleus, blue fluorescence; IL‐17 protein, green fluorescence; RANKL protein, red fluorescence; scale bar: 100 μm). F, Quantification of the proportion of IL‐17+/RANKL+ Th cells (calculated from an immunofluorescence assay). The data are shown as the mean ± SD; *P < .05 and **P < .01 represent significant differences between the indicated columns
