Figure 1.

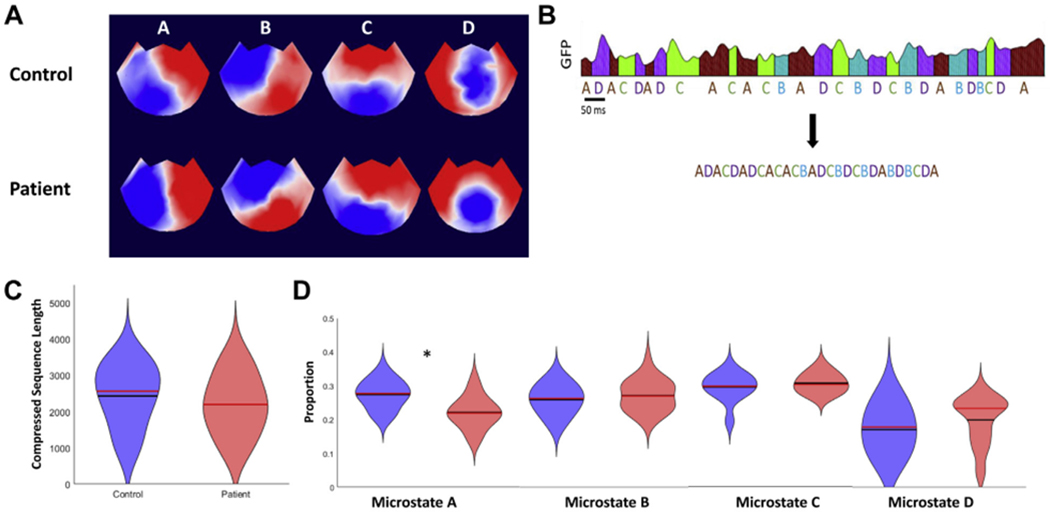
Microstate analysis and fitting. (A) Electroencephalogram (EEG) topoplots showing microstate topographies derived from quiet rest EEG recordings in control subjects and patients. Note that although red is positive and blue is negative, microstate analysis ignores polarity. The extracted microstates closely resemble the canonical 4 microstates A to D, which have been widely reported in the literature (62). (B) An EEG data set that has been fitted with microstates is then compressed by removing information about microstate duration. (C) Violin plot showing the distributions of compressed microstate sequence length for the control group (blue) and patient group (red) (63). The black lines are the means and the red lines are the medians. (D) Violin plots for the proportions of microstates A to D in the patient and control groups. *padjusted = .001. GFP, global field power.
